



























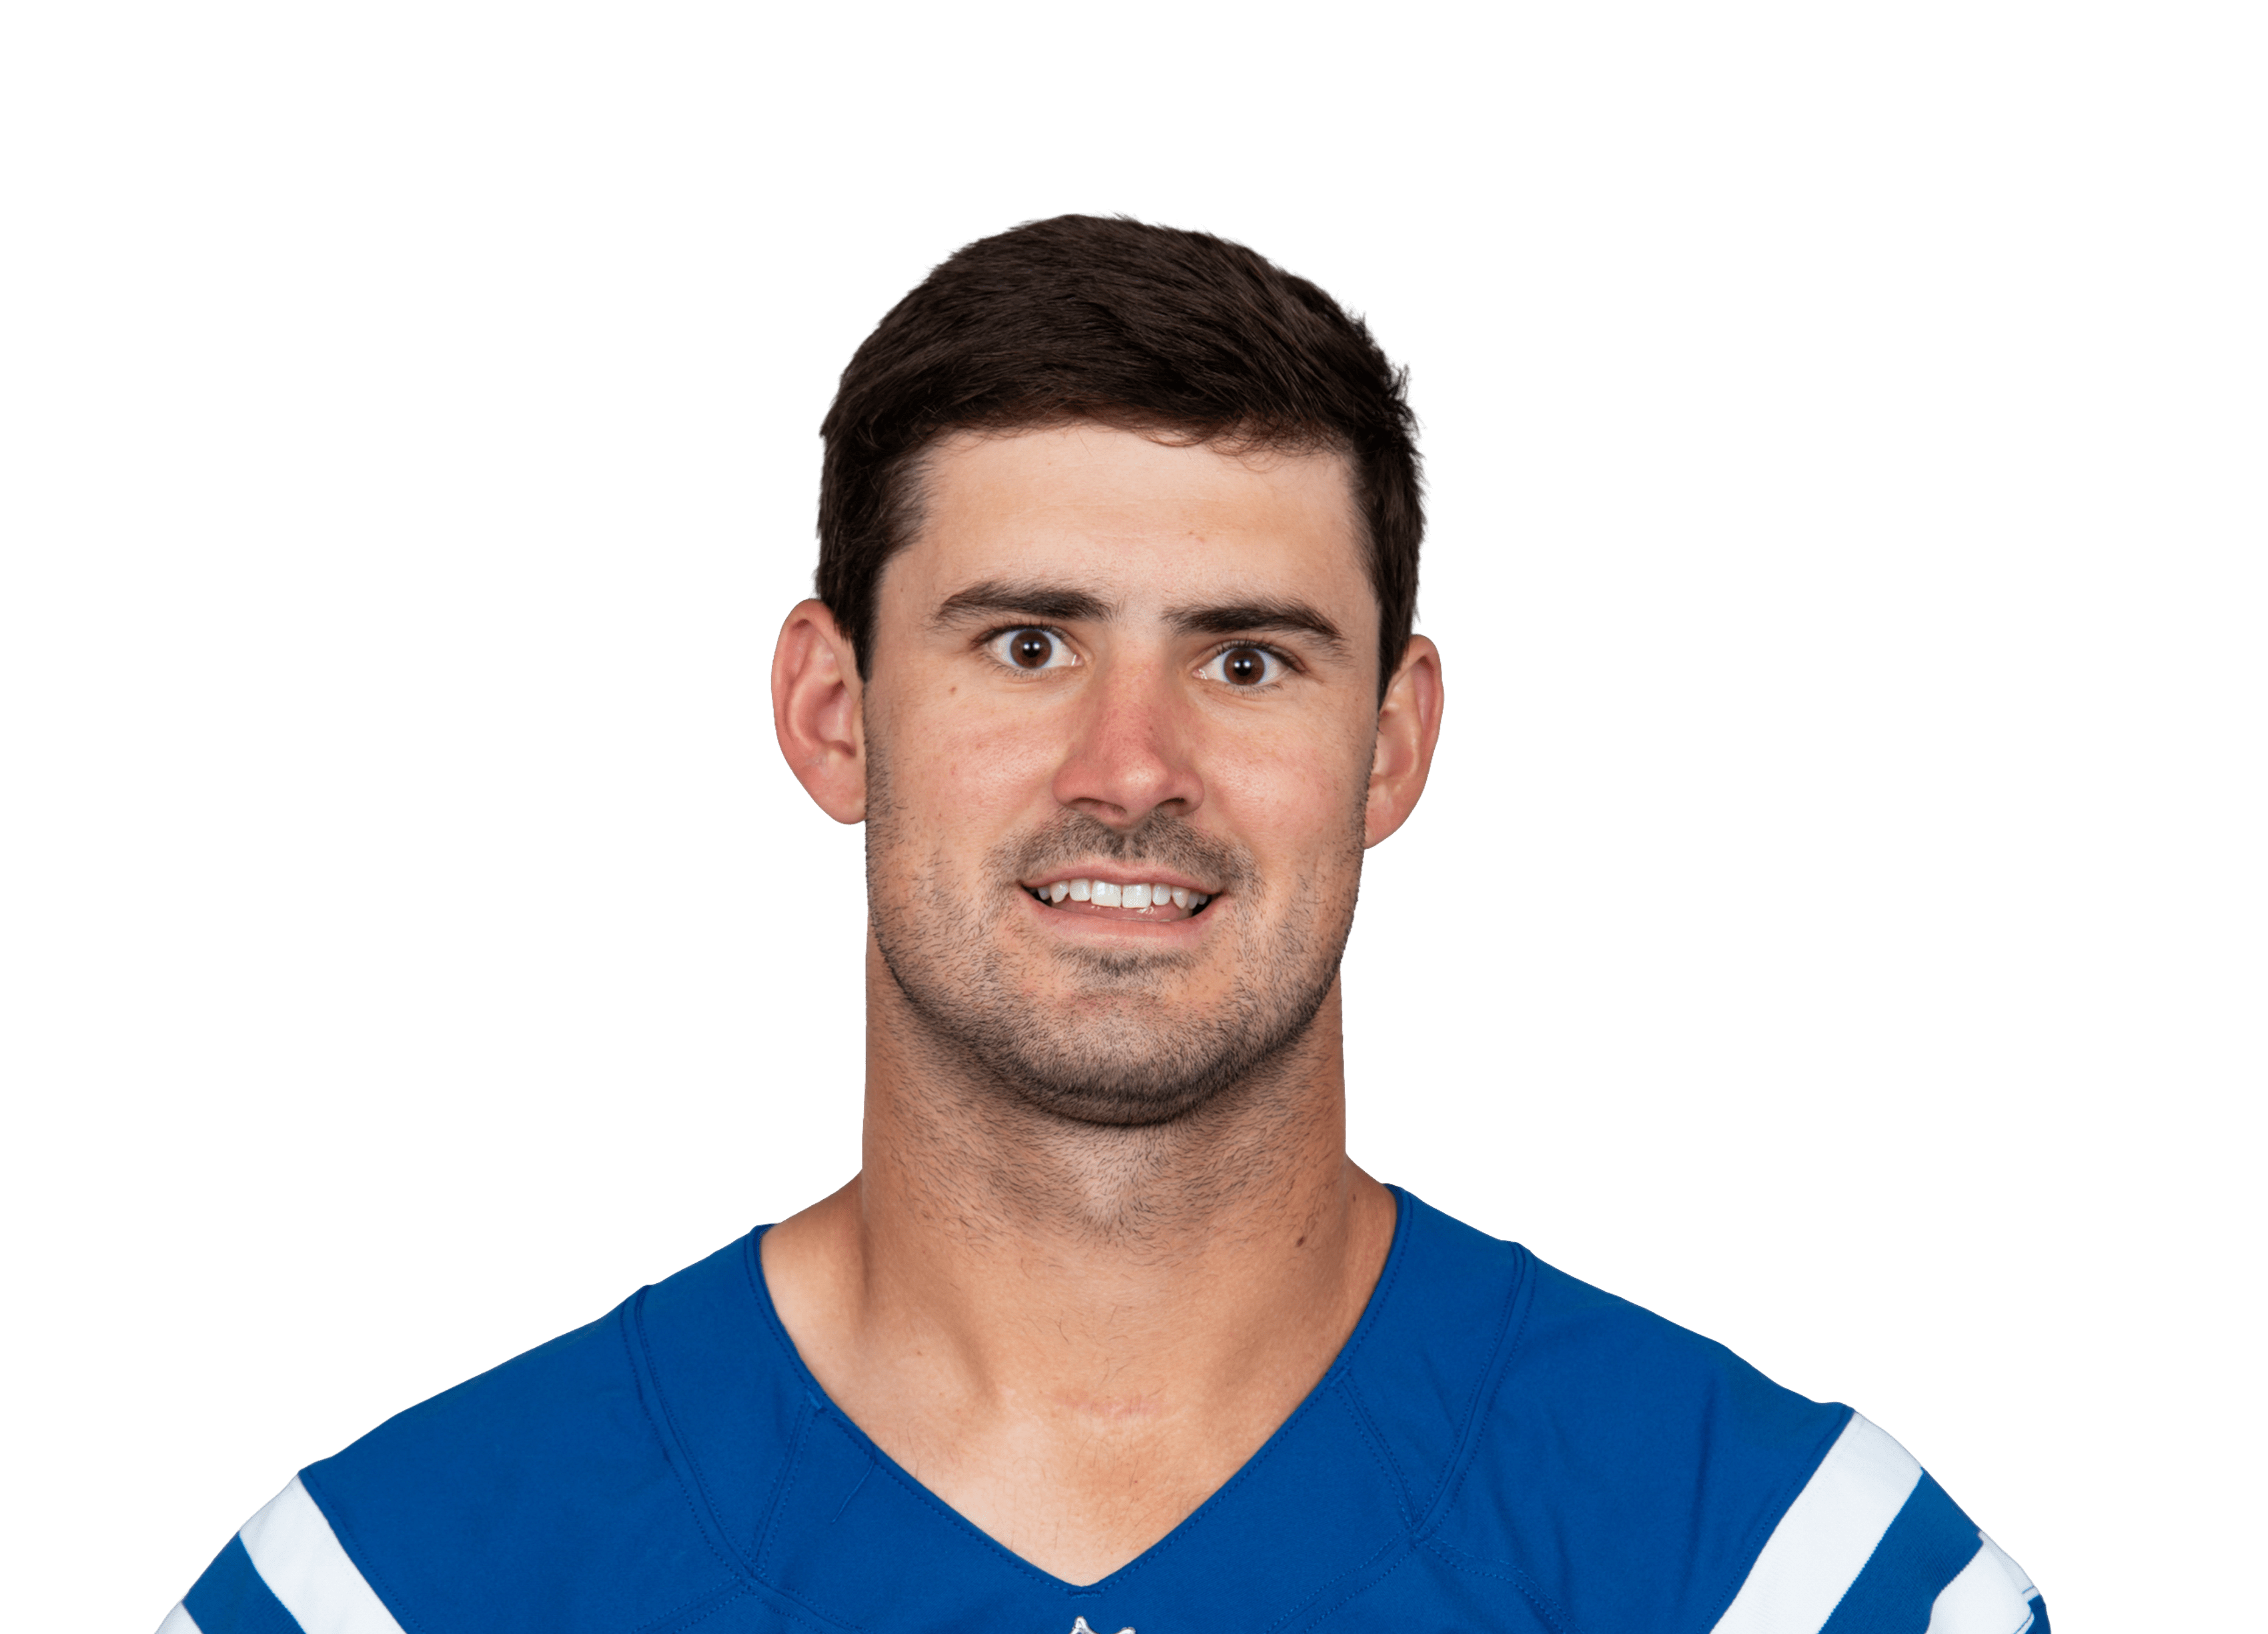
Daniel Jones #17
QB
Active
Season Stats
Game Log
Career
Prop Stats
QB Analysis
Rushing Attempts
Rushing Yards
Pass Completions
Pass Attempts
Practice
News
Daniel Jones vs All Teams
OVERPerformance over 199.5 Passing Yards (Hard Rock Bet line)
57.8%
Hit Rate
37/64
Games Hit
210.0
Avg Passing Yards
65.2%
Completion %
28.1
Avg Rush Yards
0.9
Avg TDs
Target Distribution
| Player | Position | Targets | Avg per Game | Target % | Completions | Comp % | Total Yards | Yards/Target | TDs |
|---|---|---|---|---|---|---|---|---|---|
| Darius Slayton | WR | 202 | 3.2 | 10.1% | 119 | 58.9% | 1778 | 8.8 | 4 |
| Wan'Dale Robinson | WR | 137 | 2.1 | 6.8% | 97 | 70.8% | 735 | 5.4 | 4 |
| Saquon Barkley | RB | 131 | 2.0 | 6.5% | 100 | 76.3% | 653 | 5.0 | 2 |
| Tyler Warren | TE | 120 | 1.9 | 6.0% | 90 | 75.0% | 912 | 7.6 | 6 |
| Josh Downs | WR | 107 | 1.7 | 5.3% | 68 | 63.6% | 682 | 6.4 | 3 |
| Michael Pittman | WR | 94 | 1.5 | 4.7% | 69 | 73.4% | 699 | 7.4 | 7 |
| Malik Nabers | WR | 94 | 1.5 | 4.7% | 61 | 64.9% | 607 | 6.5 | 3 |
| Richie James | WR | 86 | 1.3 | 4.3% | 68 | 79.1% | 651 | 7.6 | 4 |
| Alec Pierce | WR | 74 | 1.2 | 3.7% | 43 | 58.1% | 841 | 11.4 | 2 |
| Sterling Shepard | WR | 72 | 1.1 | 3.6% | 48 | 66.7% | 501 | 7.0 | 2 |
| Isaiah Hodgins | WR | 70 | 1.1 | 3.5% | 54 | 77.1% | 578 | 8.3 | 6 |
| Jonathan Taylor | RB | 63 | 1.0 | 3.1% | 50 | 79.4% | 467 | 7.4 | 2 |
| Kenny Golladay | WR | 51 | 0.8 | 2.5% | 27 | 52.9% | 423 | 8.3 | 0 |
| Kadarius Toney | WR | 51 | 0.8 | 2.5% | 37 | 72.5% | 392 | 7.7 | 0 |
| Daniel Bellinger | TE | 50 | 0.8 | 2.5% | 43 | 86.0% | 385 | 7.7 | 3 |
| Evan Engram | TE | 47 | 0.7 | 2.3% | 31 | 66.0% | 273 | 5.8 | 2 |
| Keenan Allen | WR | 40 | 0.6 | 2.0% | 26 | 65.0% | 227 | 5.7 | 1 |
| Darren Waller | TE | 34 | 0.5 | 1.7% | 23 | 67.6% | 239 | 7.0 | 0 |
| Theo Johnson | TE | 32 | 0.5 | 1.6% | 21 | 65.6% | 238 | 7.4 | 1 |
| Matt Breida | RB | 30 | 0.5 | 1.5% | 25 | 83.3% | 180 | 6.0 | 0 |
| Parris Campbell | WR | 25 | 0.4 | 1.2% | 18 | 72.0% | 100 | 4.0 | 0 |
| Devontae Booker | RB | 25 | 0.4 | 1.2% | 22 | 88.0% | 183 | 7.3 | 1 |
| Kyle Rudolph | TE | 24 | 0.4 | 1.2% | 17 | 70.8% | 147 | 6.1 | 1 |
| Laquon Treadwell | WR | 24 | 0.4 | 1.2% | 13 | 54.2% | 178 | 7.4 | 0 |
| Tyrone Tracy Jr. | RB | 23 | 0.4 | 1.1% | 18 | 78.3% | 117 | 5.1 | 0 |
| Jalin Hyatt | WR | 22 | 0.3 | 1.1% | 11 | 50.0% | 163 | 7.4 | 0 |
| Collin Johnson | WR | 20 | 0.3 | 1.0% | 10 | 50.0% | 89 | 4.5 | 0 |
| John Ross | WR | 18 | 0.3 | 0.9% | 10 | 55.6% | 217 | 12.1 | 1 |
| David Sills | WR | 18 | 0.3 | 0.9% | 11 | 61.1% | 106 | 5.9 | 0 |
| Marcus Johnson | WR | 17 | 0.3 | 0.8% | 7 | 41.2% | 80 | 4.7 | 0 |
| Adonai Mitchell | WR | 16 | 0.3 | 0.8% | 9 | 56.3% | 152 | 9.5 | 0 |
| Dante Pettis | WR | 16 | 0.3 | 0.8% | 10 | 62.5% | 87 | 5.4 | 1 |
| Devin Singletary | RB | 16 | 0.3 | 0.8% | 14 | 87.5% | 92 | 5.8 | 0 |
| Ashton Dulin | WR | 15 | 0.2 | 0.7% | 8 | 53.3% | 135 | 9.0 | 0 |
| Tanner Hudson | TE | 15 | 0.2 | 0.7% | 10 | 66.7% | 132 | 8.8 | 0 |
| Mo Alie-Cox | TE | 15 | 0.2 | 0.7% | 9 | 60.0% | 90 | 6.0 | 1 |
| Lawrence Cager | TE | 13 | 0.2 | 0.6% | 9 | 69.2% | 86 | 6.6 | 1 |
| Gary Brightwell | RB | 13 | 0.2 | 0.6% | 10 | 76.9% | 89 | 6.8 | 0 |
| Chris Myarick | TE | 11 | 0.2 | 0.5% | 9 | 81.8% | 76 | 6.9 | 2 |
| Eric Gray | RB | 8 | 0.1 | 0.4% | 7 | 87.5% | 70 | 8.8 | 0 |
| Ameer Abdullah | RB | 8 | 0.1 | 0.4% | 7 | 87.5% | 35 | 4.4 | 0 |
| Andrew Ogletree | TE | 7 | 0.1 | 0.3% | 4 | 57.1% | 20 | 2.9 | 1 |
| Elijhaa Penny | FB | 6 | 0.1 | 0.3% | 4 | 66.7% | 9 | 1.5 | 0 |
| Will Mallory | TE | 6 | 0.1 | 0.3% | 2 | 33.3% | 20 | 3.3 | 0 |
| C.J. Board | WR | 6 | 0.1 | 0.3% | 4 | 66.7% | 51 | 8.5 | 0 |
| Deion Burks | WR | 6 | 0.1 | 0.3% | 3 | 50.0% | 47 | 7.8 | 0 |
| Seth McGowan | RB | 4 | 0.1 | 0.2% | 3 | 75.0% | 10 | 2.5 | 0 |
| Kaden Smith | TE | 3 | 0.0 | 0.1% | 3 | 100.0% | 33 | 11.0 | 0 |
| Nick Vannett | TE | 3 | 0.0 | 0.1% | 2 | 66.7% | 24 | 8.0 | 0 |
| Tyler Goodson | RB | 3 | 0.0 | 0.1% | 2 | 66.7% | 8 | 2.7 | 0 |
| Anthony Gould | WR | 2 | 0.0 | 0.1% | 2 | 100.0% | 6 | 3.0 | 0 |
| Pharoh Cooper | WR | 2 | 0.0 | 0.1% | 1 | 50.0% | 6 | 3.0 | 0 |
| Chris Manhertz | TE | 2 | 0.0 | 0.1% | 1 | 50.0% | 2 | 1.0 | 1 |
| DJ Giddens | RB | 2 | 0.0 | 0.1% | 0 | 0.0% | 0 | 0.0 | 0 |
| Andrew Thomas | OT | 1 | 0.0 | 0.0% | 1 | 100.0% | 2 | 2.0 | 1 |
| Ben Bredeson | G | 1 | 0.0 | 0.0% | 1 | 100.0% | 0 | 0.0 | 0 |
| Nick Westbrook-Ikhine | WR | 1 | 0.0 | 0.0% | 0 | 0.0% | 0 | 0.0 | 0 |
| Anthony Richardson | QB | 1 | 0.0 | 0.0% | 1 | 100.0% | 9 | 9.0 | 0 |
| Bernhard Raimann | OT | 1 | 0.0 | 0.0% | 0 | 0.0% | 0 | 0.0 | 0 |
| Pharaoh Brown | TE | 1 | 0.0 | 0.0% | 1 | 100.0% | 7 | 7.0 | 0 |
Built from the 64 games Daniel Jones threw a pass in (team totals in games where more than one QB attempted a pass).