



























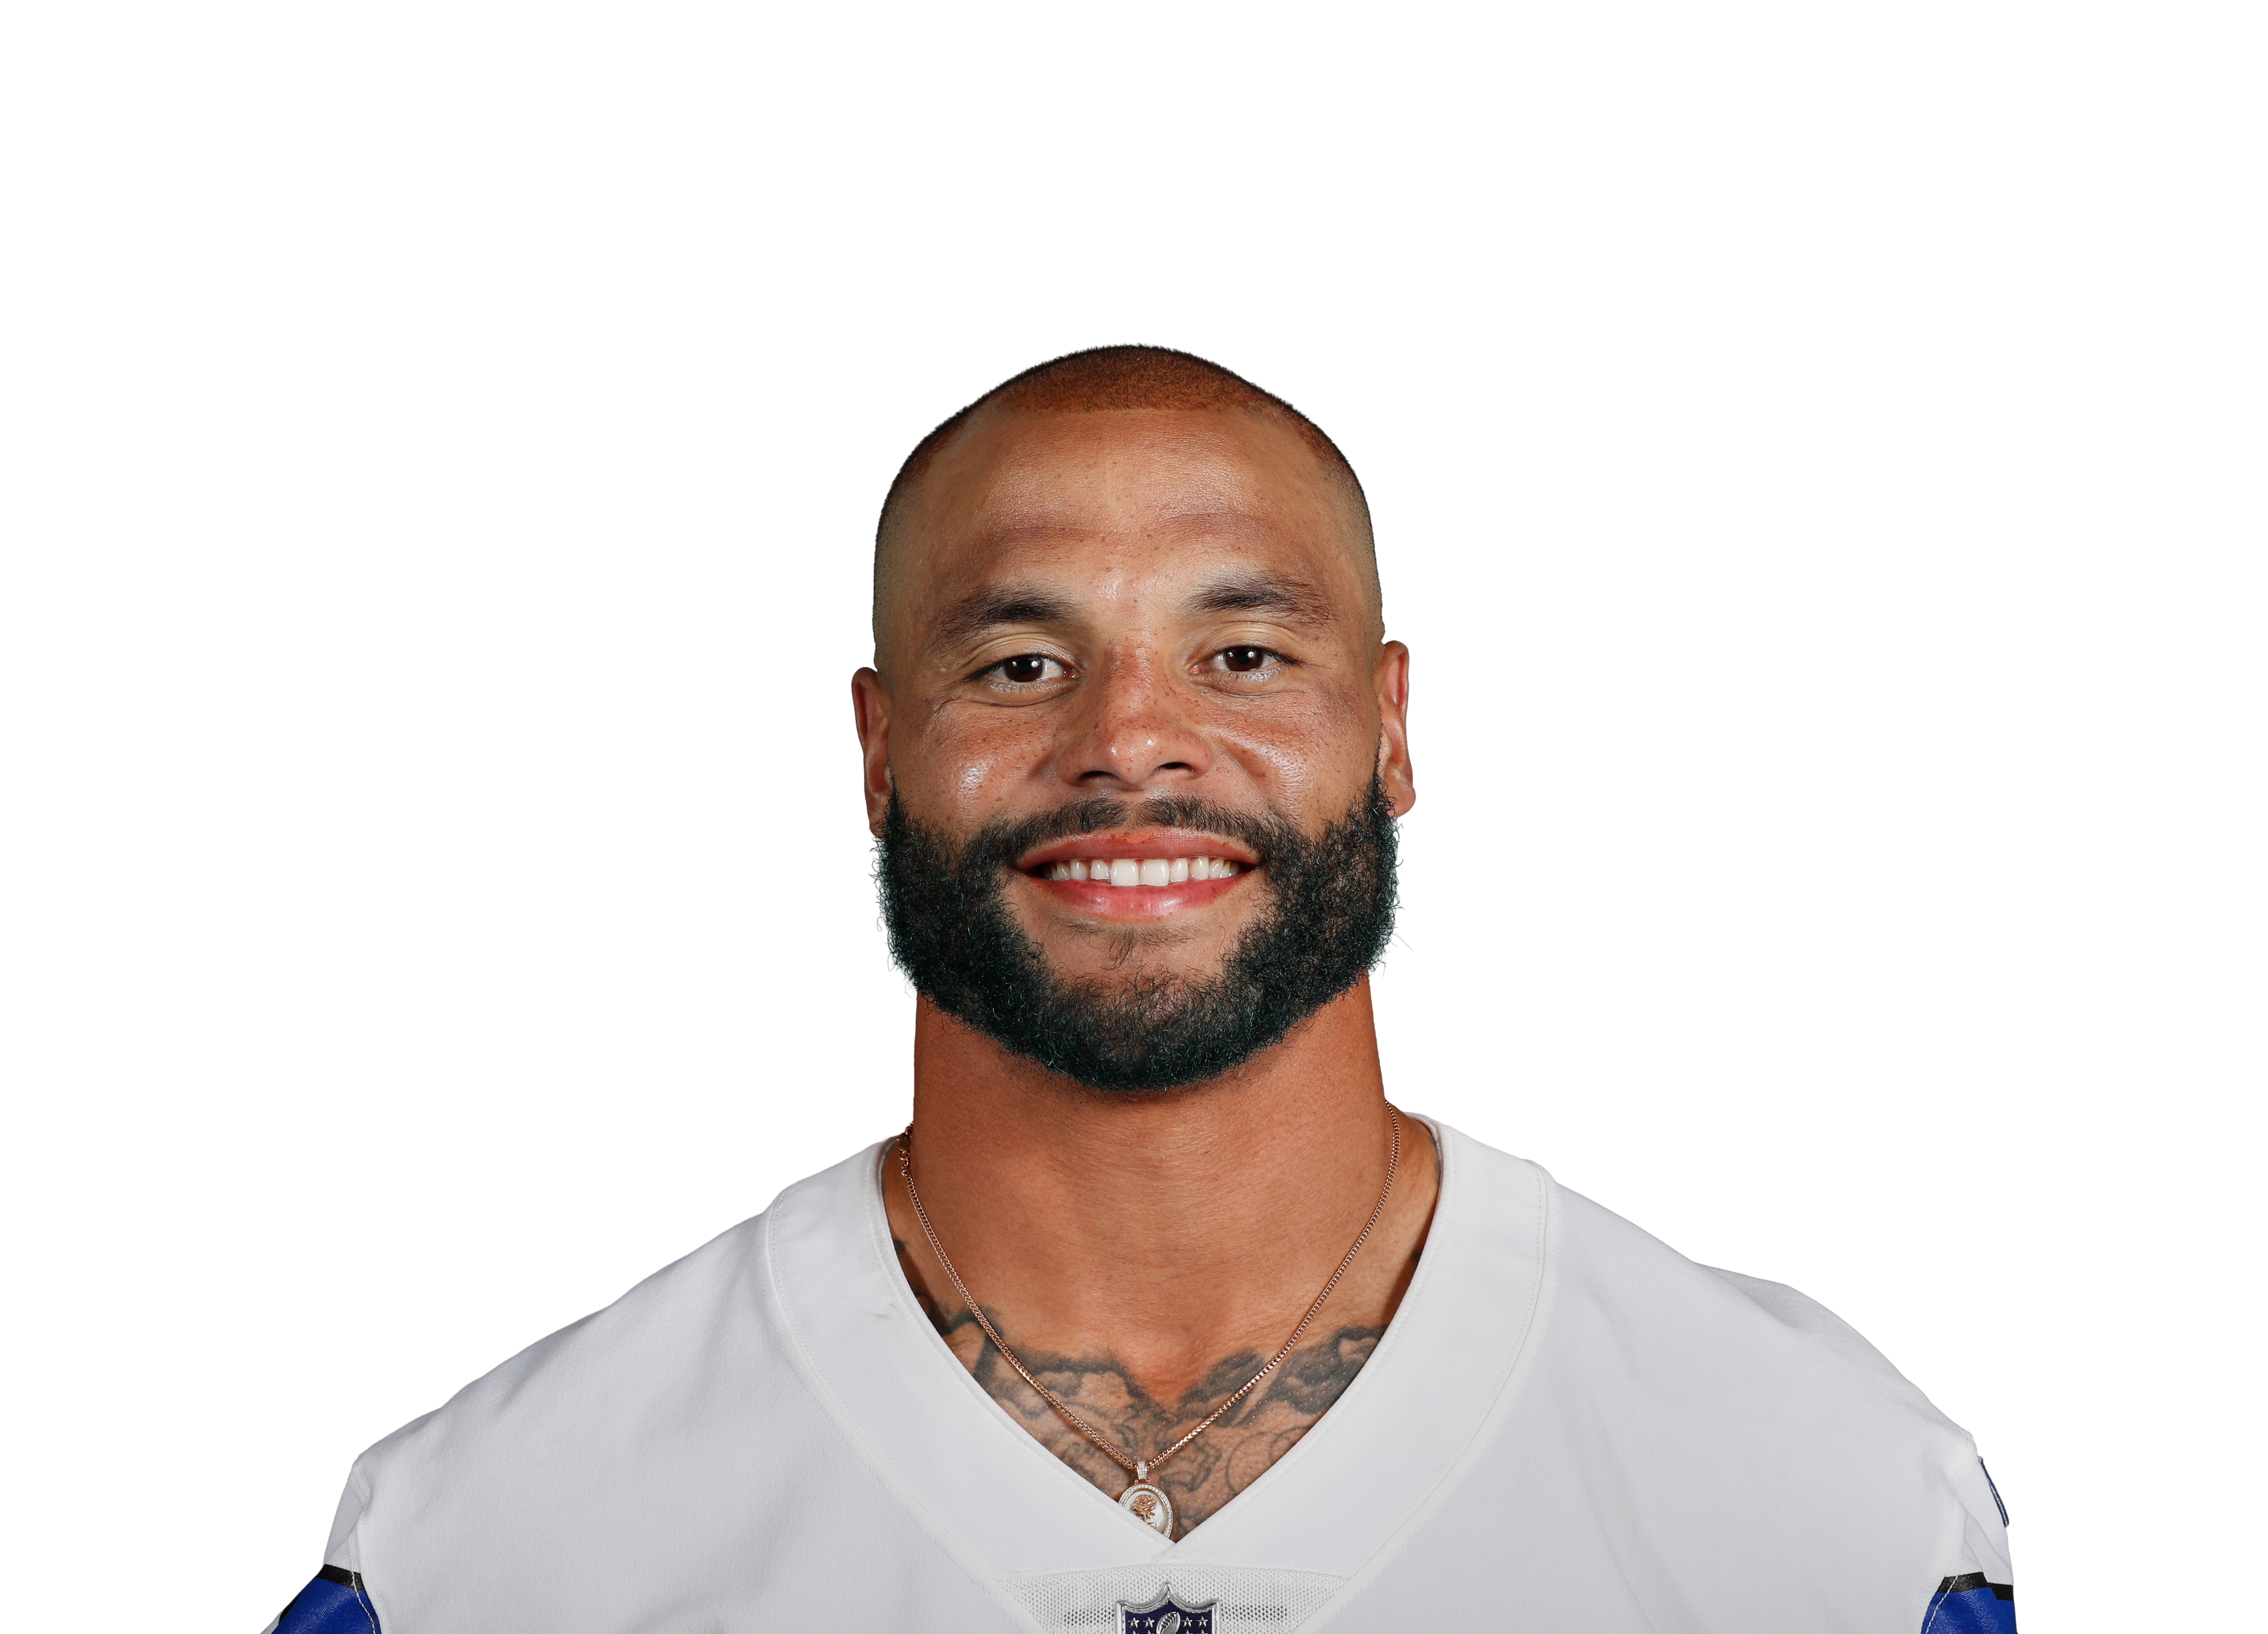
Dak Prescott #4
QB
Active
Season Stats
Game Log
Career
Prop Stats
QB Analysis
Rushing Attempts
Rushing Yards
Pass Completions
Pass Attempts
Practice
News
Dak Prescott vs All Teams
OVERPerformance over 266.5 Passing Yards (Hard Rock Bet line)
46.3%
Hit Rate
37/80
Games Hit
264.5
Avg Passing Yards
67.4%
Completion %
12.4
Avg Rush Yards
2.0
Avg TDs
Target Distribution
| Player | Position | Targets | Avg per Game | Target % | Completions | Comp % | Total Yards | Yards/Target | TDs |
|---|---|---|---|---|---|---|---|---|---|
| CeeDee Lamb | WR | 711 | 8.9 | 24.2% | 484 | 68.1% | 6348 | 8.9 | 37 |
| Jake Ferguson | TE | 305 | 3.8 | 10.4% | 231 | 75.7% | 2051 | 6.7 | 20 |
| Dalton Schultz | TE | 204 | 2.6 | 6.9% | 150 | 73.5% | 1567 | 7.7 | 16 |
| Michael Gallup | WR | 193 | 2.4 | 6.6% | 111 | 57.5% | 1350 | 7.0 | 8 |
| George Pickens | WR | 189 | 2.4 | 6.4% | 126 | 66.7% | 1857 | 9.8 | 10 |
| Tony Pollard | RB | 170 | 2.1 | 5.8% | 139 | 81.8% | 1017 | 6.0 | 3 |
| Jalen Tolbert | WR | 116 | 1.5 | 3.9% | 71 | 61.2% | 832 | 7.2 | 6 |
| Brandin Cooks | WR | 108 | 1.4 | 3.7% | 69 | 63.9% | 795 | 7.4 | 9 |
| Amari Cooper | WR | 101 | 1.3 | 3.4% | 66 | 65.3% | 807 | 8.0 | 8 |
| Ezekiel Elliott | RB | 96 | 1.2 | 3.3% | 66 | 68.8% | 377 | 3.9 | 2 |
| Ryan Flournoy | WR | 95 | 1.2 | 3.2% | 65 | 68.4% | 734 | 7.7 | 5 |
| KaVontae Turpin | WR | 93 | 1.2 | 3.2% | 61 | 65.6% | 760 | 8.2 | 6 |
| Noah Brown | WR | 78 | 1.0 | 2.7% | 47 | 60.3% | 550 | 7.1 | 2 |
| Javonte Williams | RB | 73 | 0.9 | 2.5% | 54 | 74.0% | 240 | 3.3 | 3 |
| Cedrick Wilson Jr. | WR | 68 | 0.9 | 2.3% | 47 | 69.1% | 580 | 8.5 | 5 |
| Luke Schoonmaker | TE | 52 | 0.7 | 1.8% | 34 | 65.4% | 290 | 5.6 | 2 |
| Rico Dowdle | RB | 51 | 0.6 | 1.7% | 40 | 78.4% | 321 | 6.3 | 5 |
| Hunter Luepke | RB | 33 | 0.4 | 1.1% | 29 | 87.9% | 233 | 7.1 | 1 |
| Brevyn Spann-Ford | TE | 30 | 0.4 | 1.0% | 18 | 60.0% | 178 | 5.9 | 1 |
| Jalen Brooks | WR | 26 | 0.3 | 0.9% | 13 | 50.0% | 167 | 6.4 | 0 |
| Malik Turner | WR | 17 | 0.2 | 0.6% | 13 | 76.5% | 155 | 9.1 | 3 |
| Blake Jarwin | TE | 17 | 0.2 | 0.6% | 11 | 64.7% | 96 | 5.6 | 2 |
| T.Y. Hilton | WR | 15 | 0.2 | 0.5% | 10 | 66.7% | 159 | 10.6 | 0 |
| Peyton Hendershot | TE | 15 | 0.2 | 0.5% | 10 | 66.7% | 76 | 5.1 | 2 |
| Jonathan Mingo | WR | 12 | 0.2 | 0.4% | 4 | 33.3% | 55 | 4.6 | 0 |
| Malik Davis | RB | 12 | 0.2 | 0.4% | 8 | 66.7% | 79 | 6.6 | 0 |
| Sean McKeon | TE | 10 | 0.1 | 0.3% | 5 | 50.0% | 28 | 2.8 | 1 |
| Deuce Vaughn | RB | 10 | 0.1 | 0.3% | 9 | 90.0% | 54 | 5.4 | 0 |
| Miles Sanders | RB | 8 | 0.1 | 0.3% | 8 | 100.0% | 30 | 3.8 | 0 |
| Corey Clement | RB | 7 | 0.1 | 0.2% | 6 | 85.7% | 29 | 4.1 | 1 |
| Dennis Houston | WR | 5 | 0.1 | 0.2% | 2 | 40.0% | 16 | 3.2 | 0 |
| Tyler Goodson | RB | 5 | 0.1 | 0.2% | 2 | 40.0% | 4 | 0.8 | 0 |
| Simi Fehoko | WR | 3 | 0.0 | 0.1% | 2 | 66.7% | 12 | 4.0 | 0 |
| Jeremy Sprinkle | TE | 3 | 0.0 | 0.1% | 3 | 100.0% | 31 | 10.3 | 0 |
| C.J. Goodwin | CB | 2 | 0.0 | 0.1% | 1 | 50.0% | 16 | 8.0 | 0 |
| Phil Mafah | RB | 2 | 0.0 | 0.1% | 2 | 100.0% | 11 | 5.5 | 0 |
| Jaydon Blue | RB | 1 | 0.0 | 0.0% | 1 | 100.0% | 5 | 5.0 | 0 |
| Tyler Smith | OT | 1 | 0.0 | 0.0% | 1 | 100.0% | 0 | 0.0 | 0 |
| Dalvin Cook | RB | 1 | 0.0 | 0.0% | 1 | 100.0% | 10 | 10.0 | 0 |
| Terence Steele | OT | 1 | 0.0 | 0.0% | 1 | 100.0% | 1 | 1.0 | 1 |
| James Washington | WR | 1 | 0.0 | 0.0% | 0 | 0.0% | 0 | 0.0 | 0 |
Built from the 80 games Dak Prescott threw a pass in (team totals in games where more than one QB attempted a pass).