



























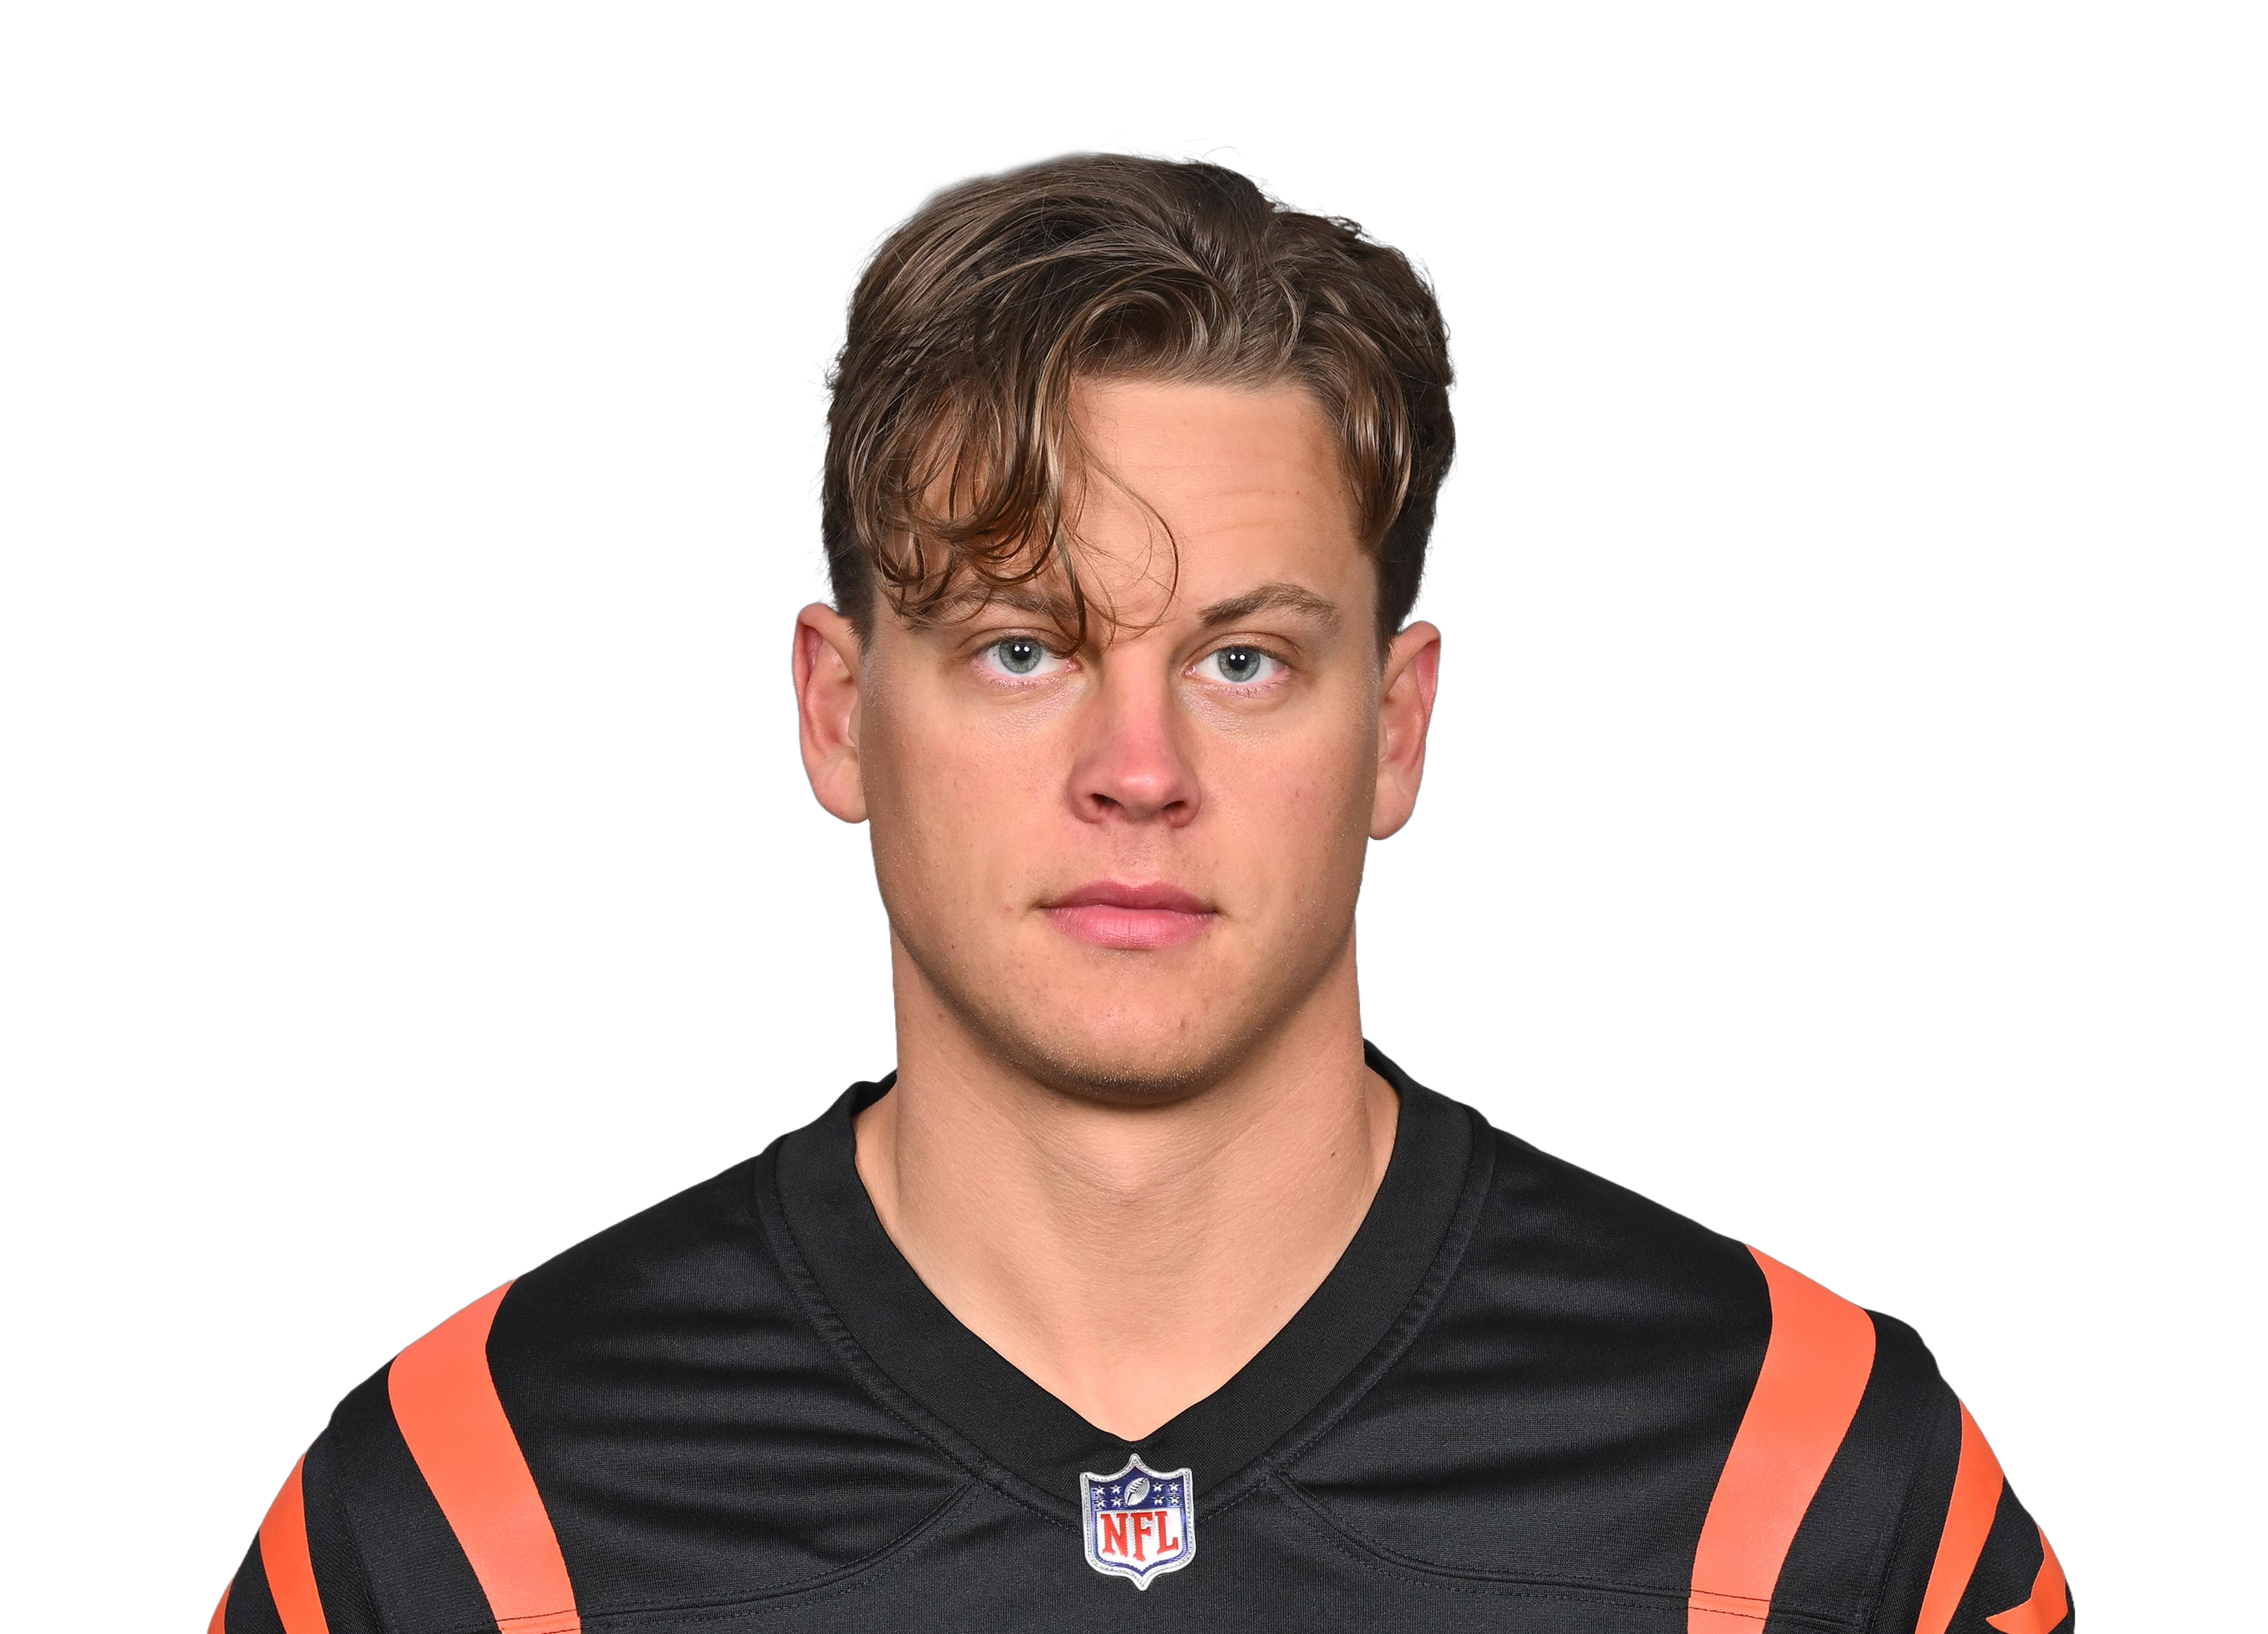
Joe Burrow #9
QB
Active
Season Stats
Game Log
Career
Prop Stats
QB Analysis
Rushing Attempts
Rushing Yards
Pass Completions
Pass Attempts
Practice
News
Joe Burrow vs All Teams
OVERPerformance over 260.5 Passing Yards (Hard Rock Bet line)
52.6%
Hit Rate
10/19
Games Hit
273.5
Avg Passing Yards
68.0%
Completion %
17.2
Avg Rush Yards
2.1
Avg TDs
Target Distribution
| Player | Position | Targets | Avg per Game | Target % | Completions | Comp % | Total Yards | Yards/Target | TDs |
|---|---|---|---|---|---|---|---|---|---|
| Ja'Marr Chase | WR | 162 | 8.5 | 23.3% | 107 | 66.0% | 1266 | 7.8 | 11 |
| Tee Higgins | WR | 130 | 6.8 | 18.7% | 87 | 66.9% | 1177 | 9.1 | 8 |
| Tyler Boyd | WR | 89 | 4.7 | 12.8% | 64 | 71.9% | 851 | 9.6 | 5 |
| Joe Mixon | RB | 85 | 4.5 | 12.2% | 68 | 80.0% | 491 | 5.8 | 2 |
| Hayden Hurst | TE | 85 | 4.5 | 12.2% | 65 | 76.5% | 555 | 6.5 | 3 |
| Samaje Perine | RB | 61 | 3.2 | 8.8% | 46 | 75.4% | 322 | 5.3 | 4 |
| Trenton Irwin | WR | 27 | 1.4 | 3.9% | 17 | 63.0% | 250 | 9.3 | 4 |
| Mitchell Wilcox | TE | 22 | 1.2 | 3.2% | 19 | 86.4% | 158 | 7.2 | 1 |
| Trent Taylor | WR | 10 | 0.5 | 1.4% | 6 | 60.0% | 62 | 6.2 | 0 |
| Mike Thomas | WR | 10 | 0.5 | 1.4% | 2 | 20.0% | 38 | 3.8 | 0 |
| Devin Asiasi | TE | 4 | 0.2 | 0.6% | 2 | 50.0% | 5 | 1.3 | 0 |
| Chris Evans | RB | 4 | 0.2 | 0.6% | 3 | 75.0% | 38 | 9.5 | 1 |
| Trayveon Williams | RB | 3 | 0.2 | 0.4% | 2 | 66.7% | 30 | 10.0 | 0 |
| Drew Sample | TE | 2 | 0.1 | 0.3% | 2 | 100.0% | -2 | -1.0 | 0 |
| Stanley Morgan | WR | 1 | 0.1 | 0.1% | 0 | 0.0% | 0 | 0.0 | 0 |
Built from the 19 games Joe Burrow threw a pass in (team totals in games where more than one QB attempted a pass).