



























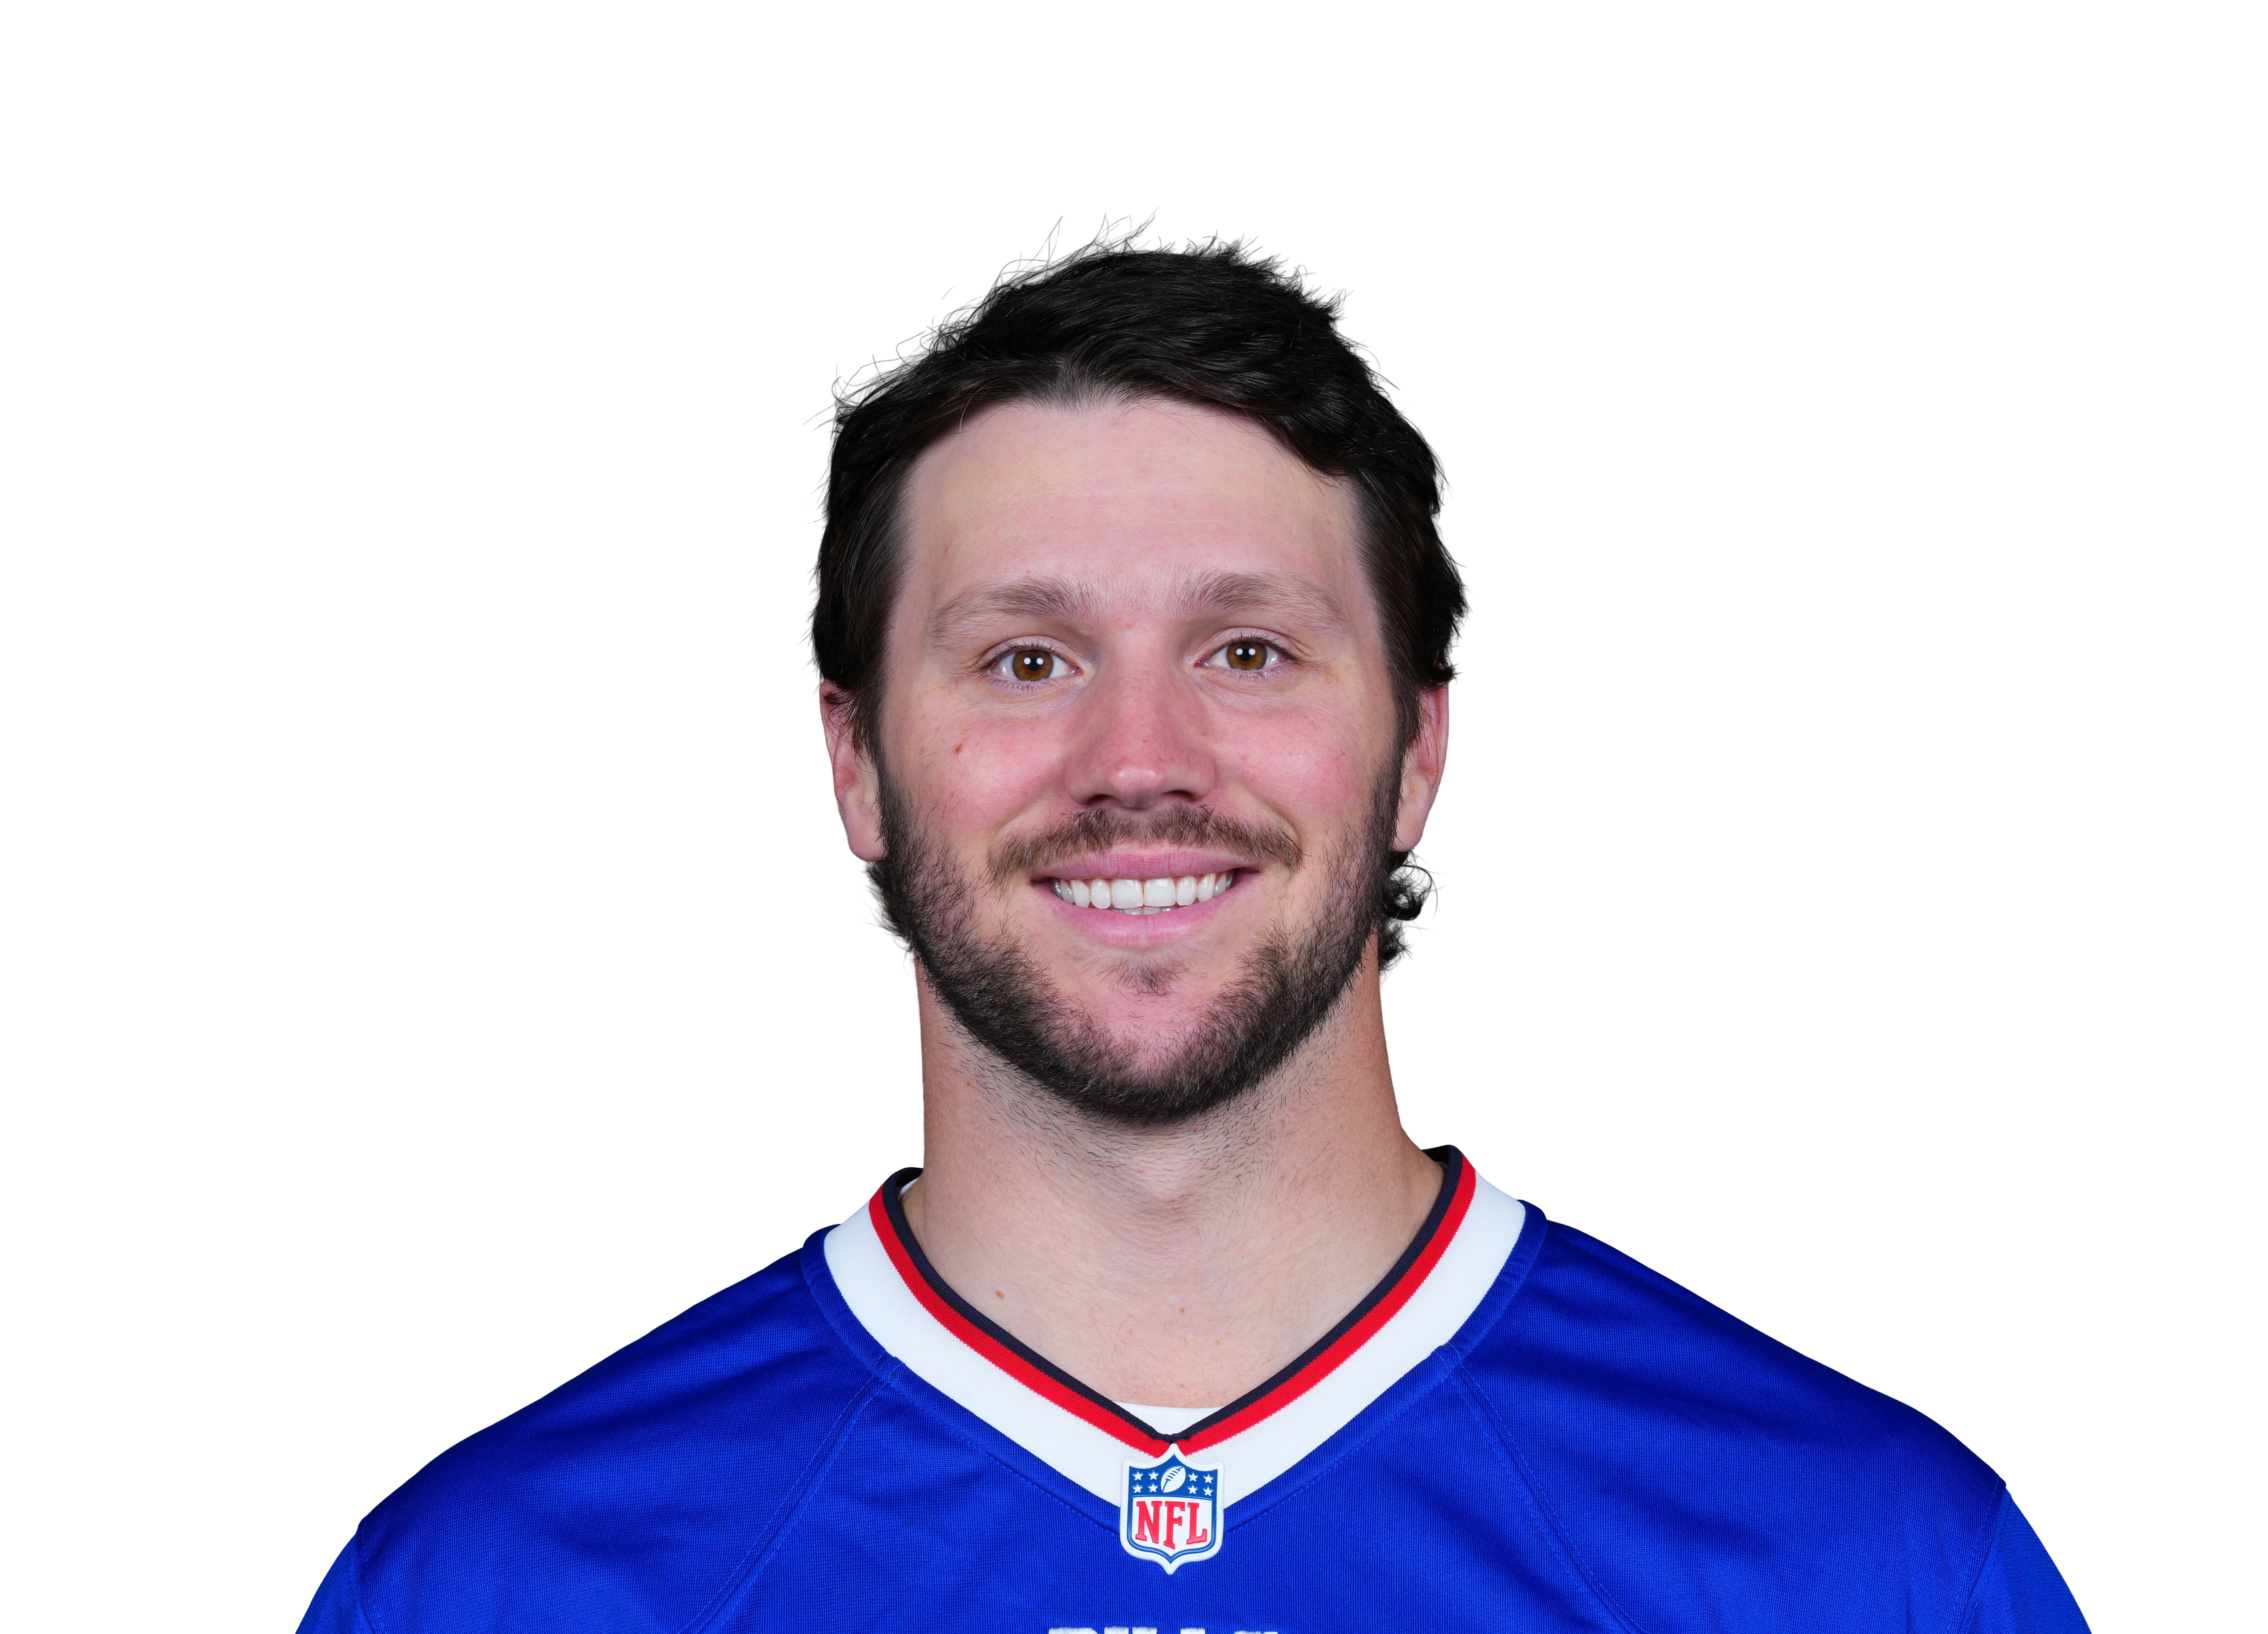
Josh Allen #17
QB
Active
Season Stats
Game Log
Career
Prop Stats
QB Analysis
Rushing Attempts
Rushing Yards
Pass Completions
Pass Attempts
Practice
News
Josh Allen vs All Teams
No Hard Rock Bet passing-yards line for his next game yet — hit-rate cards appear once Hard Rock posts it.
249.8
Avg Passing Yards
65.6%
Completion %
39.7
Avg Rush Yards
1.9
Avg TDs
Target Distribution
| Player | Position | Targets | Avg per Game | Target % | Completions | Comp % | Total Yards | Yards/Target | TDs |
|---|---|---|---|---|---|---|---|---|---|
| Stefon Diggs | WR | 524 | 5.3 | 16.6% | 345 | 65.8% | 4126 | 7.9 | 29 |
| Khalil Shakir | WR | 352 | 3.6 | 11.2% | 271 | 77.0% | 3099 | 8.8 | 14 |
| Dawson Knox | TE | 300 | 3.0 | 9.5% | 210 | 70.0% | 2333 | 7.8 | 26 |
| Gabe Davis | WR | 277 | 2.8 | 8.8% | 155 | 56.0% | 2622 | 9.5 | 26 |
| Dalton Kincaid | TE | 272 | 2.7 | 8.6% | 199 | 73.2% | 2245 | 8.3 | 13 |
| James Cook | RB | 199 | 2.0 | 6.3% | 158 | 79.4% | 1382 | 6.9 | 9 |
| Keon Coleman | WR | 138 | 1.4 | 4.4% | 87 | 63.0% | 1231 | 8.9 | 12 |
| Cole Beasley | WR | 132 | 1.3 | 4.2% | 96 | 72.7% | 858 | 6.5 | 2 |
| Devin Singletary | RB | 119 | 1.2 | 3.8% | 90 | 75.6% | 583 | 4.9 | 2 |
| Isaiah McKenzie | WR | 97 | 1.0 | 3.1% | 68 | 70.1% | 659 | 6.8 | 5 |
| Ty Johnson | RB | 80 | 0.8 | 2.5% | 63 | 78.8% | 792 | 9.9 | 6 |
| Emmanuel Sanders | WR | 76 | 0.8 | 2.4% | 45 | 59.2% | 678 | 8.9 | 5 |
| Curtis Samuel | WR | 58 | 0.6 | 1.8% | 38 | 65.5% | 365 | 6.3 | 4 |
| Mack Hollins | WR | 54 | 0.5 | 1.7% | 33 | 61.1% | 457 | 8.5 | 6 |
| Josh Palmer | WR | 45 | 0.5 | 1.4% | 25 | 55.6% | 419 | 9.3 | 2 |
| Zack Moss | RB | 40 | 0.4 | 1.3% | 30 | 75.0% | 224 | 5.6 | 1 |
| Amari Cooper | WR | 40 | 0.4 | 1.3% | 26 | 65.0% | 338 | 8.5 | 2 |
| Ray Davis | RB | 32 | 0.3 | 1.0% | 28 | 87.5% | 324 | 10.1 | 3 |
| Latavius Murray | RB | 28 | 0.3 | 0.9% | 22 | 78.6% | 159 | 5.7 | 0 |
| Tyrell Shavers | WR | 26 | 0.3 | 0.8% | 17 | 65.4% | 328 | 12.6 | 2 |
| Trent Sherfield | WR | 25 | 0.3 | 0.8% | 12 | 48.0% | 93 | 3.7 | 1 |
| Deonte Harty | WR | 23 | 0.2 | 0.7% | 17 | 73.9% | 187 | 8.1 | 1 |
| Brandin Cooks | WR | 22 | 0.2 | 0.7% | 10 | 45.5% | 192 | 8.7 | 0 |
| Quintin Morris | TE | 21 | 0.2 | 0.7% | 14 | 66.7% | 144 | 6.9 | 3 |
| DJ Moore | WR | 20 | 0.2 | 0.6% | 12 | 60.0% | 178 | 8.9 | 1 |
| Reggie Gilliam | RB | 20 | 0.2 | 0.6% | 16 | 80.0% | 109 | 5.5 | 1 |
| Jackson Hawes | TE | 19 | 0.2 | 0.6% | 15 | 78.9% | 187 | 9.8 | 3 |
| Elijah Moore | WR | 17 | 0.2 | 0.5% | 9 | 52.9% | 112 | 6.6 | 0 |
| Jamison Crowder | WR | 13 | 0.1 | 0.4% | 6 | 46.2% | 60 | 4.6 | 0 |
| Tommy Sweeney | TE | 13 | 0.1 | 0.4% | 10 | 76.9% | 51 | 3.9 | 1 |
| Jake Kumerow | WR | 13 | 0.1 | 0.4% | 6 | 46.2% | 92 | 7.1 | 0 |
| Nyheim Hines | RB | 12 | 0.1 | 0.4% | 7 | 58.3% | 64 | 5.3 | 1 |
| Marquez Valdes-Scantling | WR | 9 | 0.1 | 0.3% | 2 | 22.2% | 26 | 2.9 | 0 |
| Matt Breida | RB | 9 | 0.1 | 0.3% | 7 | 77.8% | 72 | 8.0 | 2 |
| Isaiah Hodgins | WR | 6 | 0.1 | 0.2% | 4 | 66.7% | 41 | 6.8 | 0 |
| Mecole Hardman | WR | 3 | 0.0 | 0.1% | 1 | 33.3% | 4 | 1.3 | 1 |
| John Brown | WR | 3 | 0.0 | 0.1% | 1 | 33.3% | 42 | 14.0 | 1 |
| Skyler Bell | WR | 3 | 0.0 | 0.1% | 0 | 0.0% | 0 | 0.0 | 0 |
| Damien Harris | RB | 2 | 0.0 | 0.1% | 2 | 100.0% | 16 | 8.0 | 0 |
| Zach Davidson | TE | 2 | 0.0 | 0.1% | 1 | 50.0% | 5 | 2.5 | 0 |
| Keleki Latu | TE | 1 | 0.0 | 0.0% | 1 | 100.0% | 4 | 4.0 | 0 |
| Tanner Gentry | WR | 1 | 0.0 | 0.0% | 0 | 0.0% | 0 | 0.0 | 0 |
| Frank Gore Jr. | RB | 1 | 0.0 | 0.0% | 1 | 100.0% | 6 | 6.0 | 0 |
| Tommy Doyle | OT | 1 | 0.0 | 0.0% | 1 | 100.0% | 1 | 1.0 | 1 |
| Andy Isabella | WR | 1 | 0.0 | 0.0% | 0 | 0.0% | 0 | 0.0 | 0 |
| Dion Dawkins | OT | 1 | 0.0 | 0.0% | 0 | 0.0% | 0 | 0.0 | 0 |
Built from the 99 games Josh Allen threw a pass in (team totals in games where more than one QB attempted a pass).