



























Season Stats
Game Log
Career
Prop Stats
QB Analysis
Rushing Attempts
Rushing Yards
Pass Completions
Pass Attempts
Practice
News
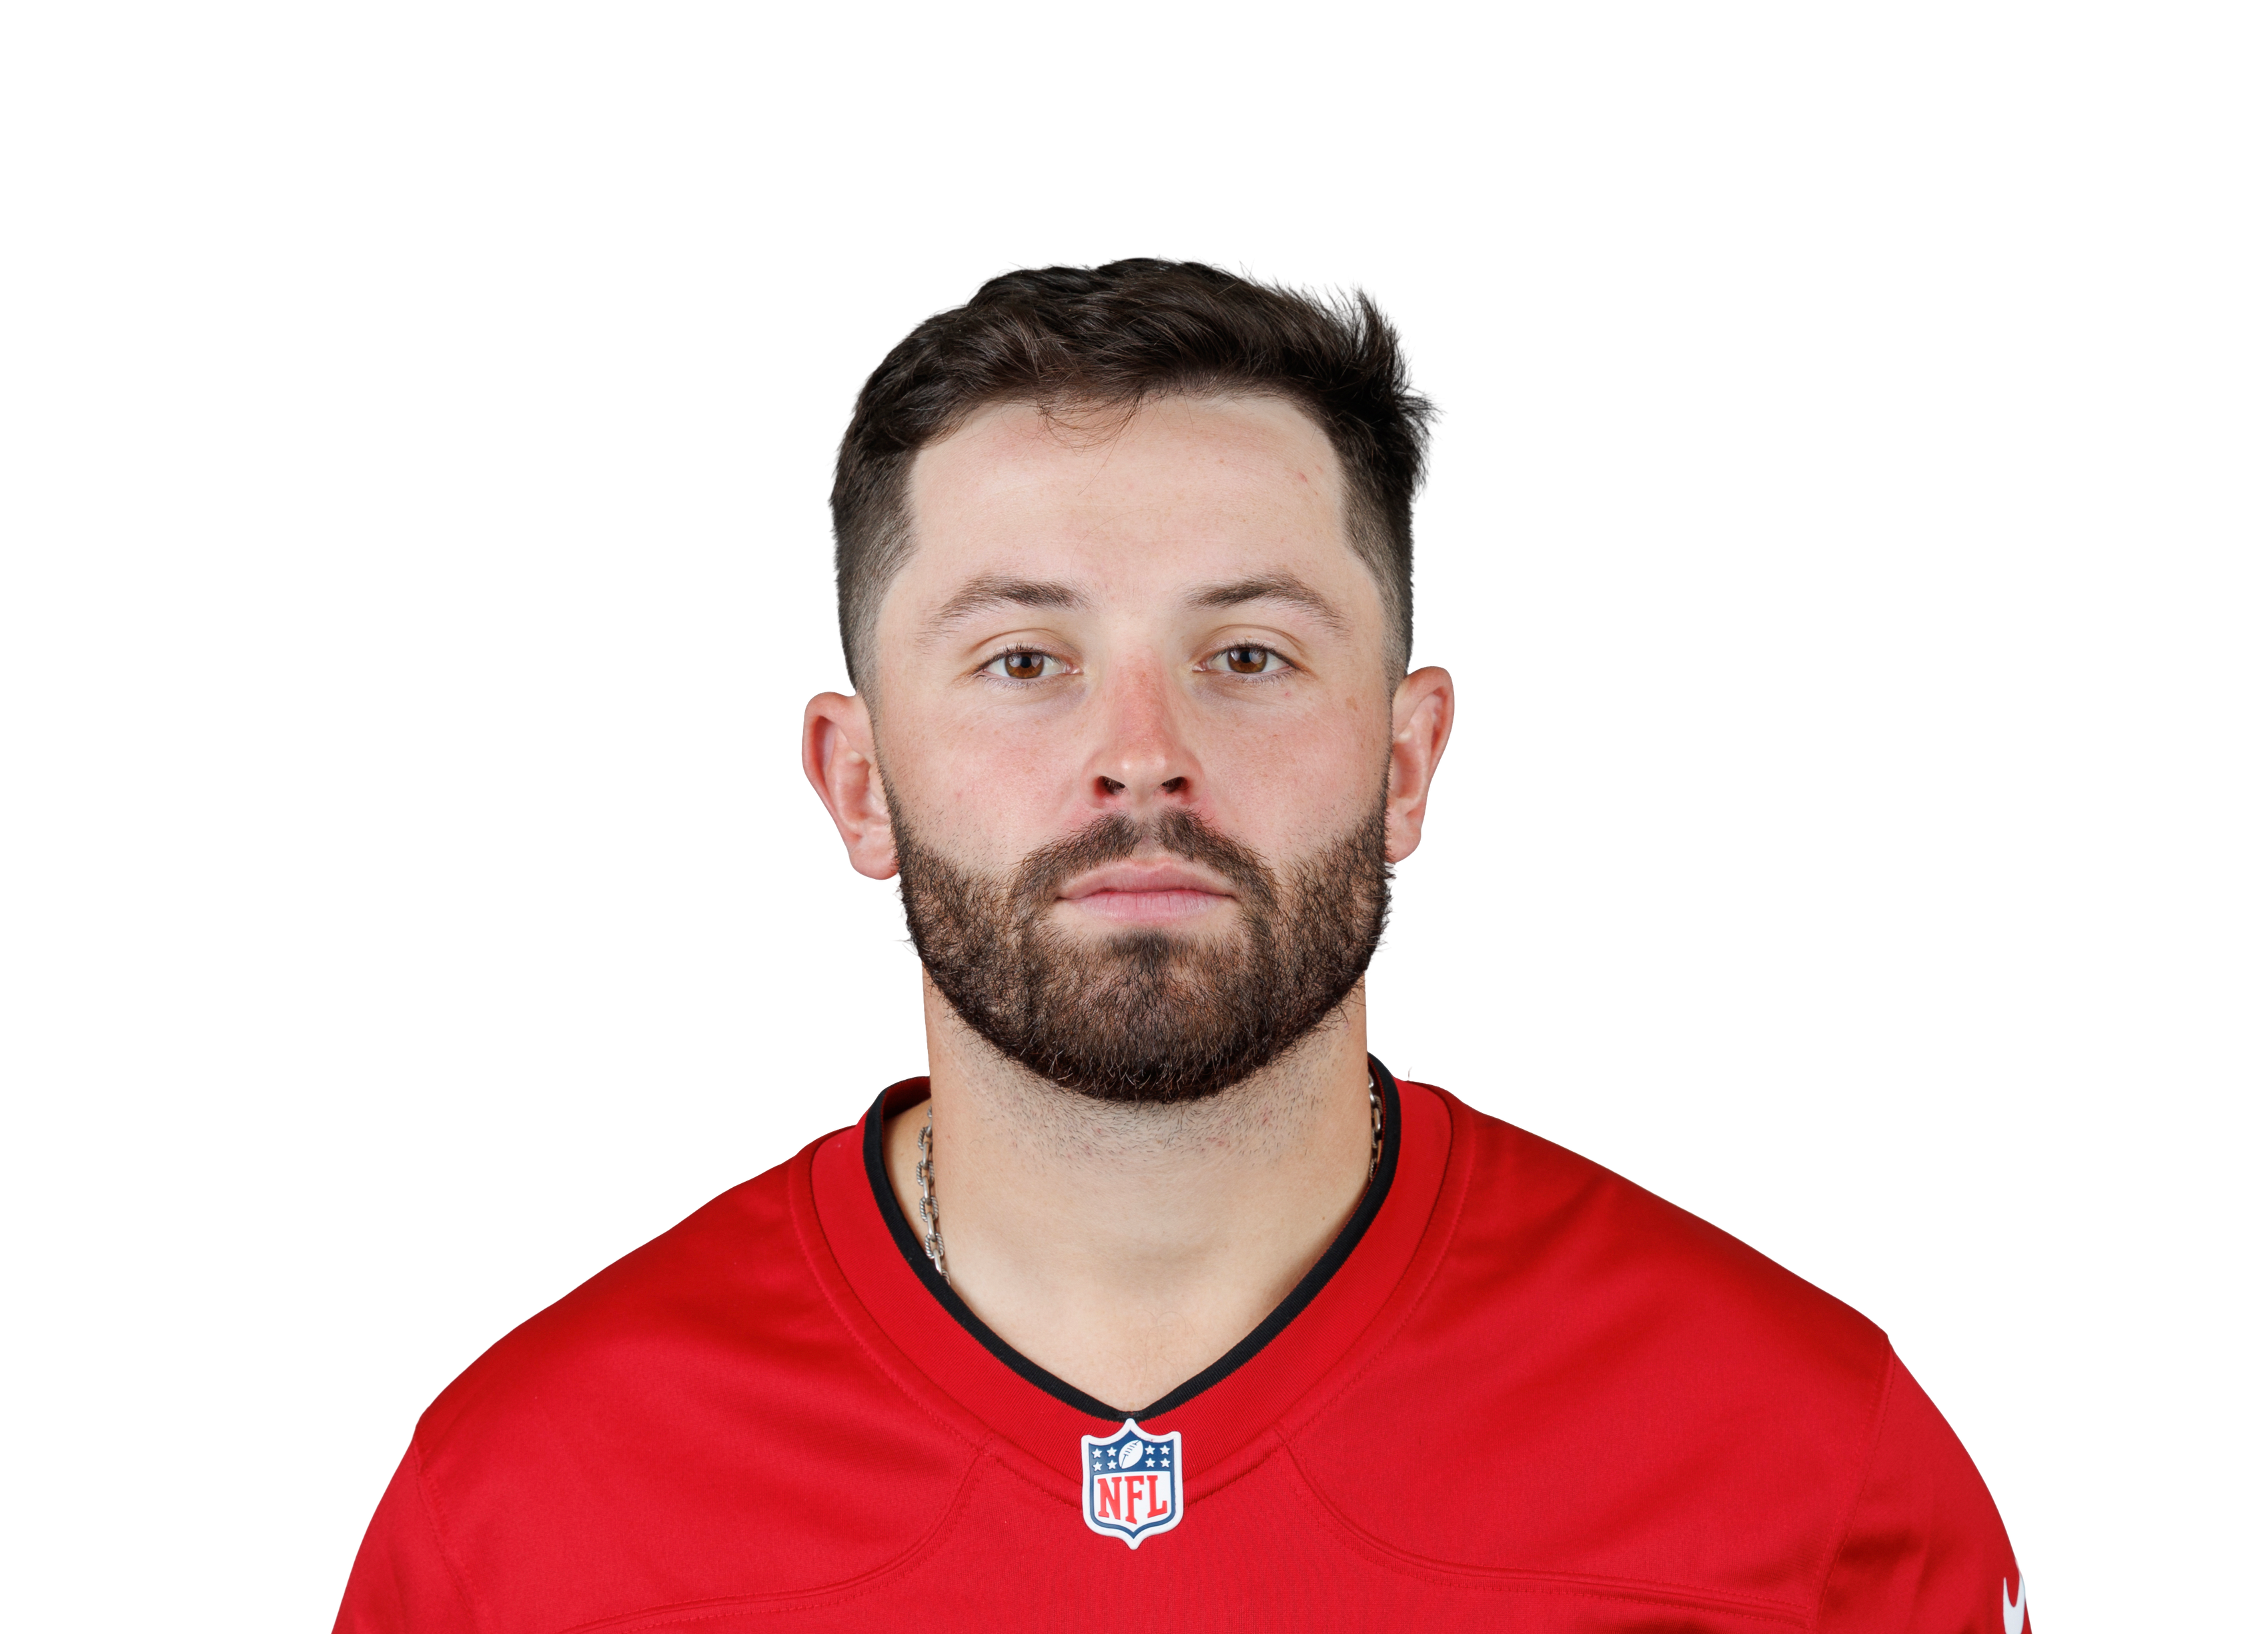
Baker Mayfield vs All Teams
No Hard Rock Bet passing-yards line for his next game yet — hit-rate cards appear once Hard Rock posts it.
227.7
Avg Passing Yards
64.5%
Completion %
15.2
Avg Rush Yards
1.6
Avg TDs
Target Distribution
| Player | Position | Targets | Avg per Game | Target % | Completions | Comp % | Total Yards | Yards/Target | TDs |
|---|---|---|---|---|---|---|---|---|---|
| Mike Evans | WR | 334 | 4.0 | 12.9% | 201 | 60.2% | 2914 | 8.7 | 29 |
| Cade Otton | TE | 273 | 3.3 | 10.5% | 191 | 70.0% | 1933 | 7.1 | 10 |
| Chris Godwin Jr. | WR | 267 | 3.2 | 10.3% | 184 | 68.9% | 2156 | 8.1 | 10 |
| Rachaad White | RB | 182 | 2.2 | 7.0% | 162 | 89.0% | 1213 | 6.7 | 10 |
| Emeka Egbuka | WR | 147 | 1.8 | 5.7% | 76 | 51.7% | 1079 | 7.3 | 7 |
| Bucky Irving | RB | 104 | 1.3 | 4.0% | 92 | 88.5% | 736 | 7.1 | 4 |
| Sterling Shepard | WR | 104 | 1.3 | 4.0% | 71 | 68.3% | 705 | 6.8 | 2 |
| Trey Palmer | WR | 94 | 1.1 | 3.6% | 54 | 57.4% | 645 | 6.9 | 5 |
| Jalen McMillan | WR | 78 | 0.9 | 3.0% | 51 | 65.4% | 680 | 8.7 | 8 |
| Jarvis Landry | WR | 71 | 0.9 | 2.7% | 41 | 57.7% | 458 | 6.5 | 1 |
| Austin Hooper | TE | 58 | 0.7 | 2.2% | 36 | 62.1% | 303 | 5.2 | 3 |
| Tez Johnson | WR | 51 | 0.6 | 2.0% | 30 | 58.8% | 379 | 7.4 | 5 |
| DJ Moore | WR | 48 | 0.6 | 1.9% | 22 | 45.8% | 245 | 5.1 | 1 |
| Donovan Peoples-Jones | WR | 46 | 0.6 | 1.8% | 27 | 58.7% | 511 | 11.1 | 3 |
| David Njoku | TE | 44 | 0.5 | 1.7% | 29 | 65.9% | 417 | 9.5 | 4 |
| Rashard Higgins | WR | 40 | 0.5 | 1.5% | 20 | 50.0% | 253 | 6.3 | 1 |
| Christian McCaffrey | RB | 35 | 0.4 | 1.4% | 26 | 74.3% | 188 | 5.4 | 1 |
| Tyler Higbee | TE | 30 | 0.4 | 1.2% | 22 | 73.3% | 176 | 5.9 | 3 |
| Odell Beckham Jr. | WR | 28 | 0.3 | 1.1% | 15 | 53.6% | 209 | 7.5 | 0 |
| Kareem Hunt | RB | 27 | 0.3 | 1.0% | 22 | 81.5% | 174 | 6.4 | 0 |
| Payne Durham | TE | 27 | 0.3 | 1.0% | 18 | 66.7% | 202 | 7.5 | 2 |
| Deven Thompkins | WR | 27 | 0.3 | 1.0% | 18 | 66.7% | 87 | 3.2 | 1 |
| Robbie Chosen | WR | 27 | 0.3 | 1.0% | 13 | 48.1% | 206 | 7.6 | 1 |
| Sean Tucker | RB | 25 | 0.3 | 1.0% | 19 | 76.0% | 152 | 6.1 | 2 |
| Shi Smith | WR | 25 | 0.3 | 1.0% | 13 | 52.0% | 151 | 6.0 | 0 |
| Ryan Miller | WR | 24 | 0.3 | 0.9% | 14 | 58.3% | 162 | 6.8 | 3 |
| Tutu Atwell | WR | 23 | 0.3 | 0.9% | 12 | 52.2% | 111 | 4.8 | 0 |
| Nick Chubb | RB | 23 | 0.3 | 0.9% | 18 | 78.3% | 170 | 7.4 | 1 |
| Chase Edmonds | RB | 21 | 0.3 | 0.8% | 17 | 81.0% | 107 | 5.1 | 0 |
| Harrison Bryant | TE | 21 | 0.3 | 0.8% | 17 | 81.0% | 198 | 9.4 | 2 |
| Van Jefferson | WR | 21 | 0.3 | 0.8% | 13 | 61.9% | 233 | 11.1 | 1 |
| Rakim Jarrett | WR | 20 | 0.2 | 0.8% | 13 | 65.0% | 184 | 9.2 | 0 |
| D'Ernest Johnson | RB | 18 | 0.2 | 0.7% | 12 | 66.7% | 88 | 4.9 | 0 |
| Ian Thomas | TE | 18 | 0.2 | 0.7% | 11 | 61.1% | 117 | 6.5 | 0 |
| Anthony Schwartz | WR | 17 | 0.2 | 0.7% | 7 | 41.2% | 100 | 5.9 | 1 |
| Terrace Marshall Jr. | WR | 16 | 0.2 | 0.6% | 10 | 62.5% | 159 | 9.9 | 1 |
| Tommy Tremble | TE | 13 | 0.2 | 0.5% | 7 | 53.8% | 53 | 4.1 | 1 |
| Ted Hurst III | WR | 13 | 0.2 | 0.5% | 6 | 46.2% | 103 | 7.9 | 1 |
| Demetric Felton | RB | 12 | 0.1 | 0.5% | 10 | 83.3% | 126 | 10.5 | 1 |
| Brandon Powell | WR | 12 | 0.1 | 0.5% | 6 | 50.0% | 21 | 1.8 | 0 |
| Cam Akers | RB | 11 | 0.1 | 0.4% | 10 | 90.9% | 99 | 9.0 | 0 |
| David Moore | WR | 11 | 0.1 | 0.4% | 8 | 72.7% | 171 | 15.5 | 2 |
| Ben Skowronek | WR | 11 | 0.1 | 0.4% | 8 | 72.7% | 92 | 8.4 | 0 |
| Kenny Gainwell | RB | 10 | 0.1 | 0.4% | 6 | 60.0% | 22 | 2.2 | 0 |
| Kameron Johnson | WR | 8 | 0.1 | 0.3% | 4 | 50.0% | 64 | 8.0 | 1 |
| Devin Culp | TE | 7 | 0.1 | 0.3% | 6 | 85.7% | 94 | 13.4 | 1 |
| Giovanni Ricci | TE | 7 | 0.1 | 0.3% | 6 | 85.7% | 66 | 9.4 | 0 |
| Raheem Blackshear | RB | 7 | 0.1 | 0.3% | 6 | 85.7% | 54 | 7.7 | 0 |
| Laviska Shenault Jr. | WR | 7 | 0.1 | 0.3% | 6 | 85.7% | 97 | 13.9 | 1 |
| Brycen Hopkins | TE | 6 | 0.1 | 0.2% | 5 | 83.3% | 86 | 14.3 | 0 |
| Ke'Shawn Vaughn | RB | 5 | 0.1 | 0.2% | 2 | 40.0% | 2 | 0.4 | 0 |
| Ko Kieft | TE | 5 | 0.1 | 0.2% | 1 | 20.0% | 2 | 0.4 | 1 |
| Andy Janovich | FB | 4 | 0.0 | 0.2% | 3 | 75.0% | 9 | 2.3 | 0 |
| D'Onta Foreman | RB | 4 | 0.0 | 0.2% | 2 | 50.0% | -2 | -0.5 | 0 |
| Malcolm Brown | RB | 4 | 0.0 | 0.2% | 3 | 75.0% | 14 | 3.5 | 0 |
| Ja'Marcus Bradley | WR | 4 | 0.0 | 0.2% | 4 | 100.0% | 64 | 16.0 | 0 |
| Chuba Hubbard | RB | 3 | 0.0 | 0.1% | 2 | 66.7% | 25 | 8.3 | 0 |
| Kyren Williams | RB | 3 | 0.0 | 0.1% | 2 | 66.7% | 13 | 4.3 | 0 |
| Spencer Brown | RB | 3 | 0.0 | 0.1% | 2 | 66.7% | 10 | 3.3 | 0 |
| Austin Trammell | WR | 2 | 0.0 | 0.1% | 1 | 50.0% | 5 | 2.5 | 0 |
| David Wells | TE | 2 | 0.0 | 0.1% | 2 | 100.0% | -10 | -5.0 | 0 |
| Tristan Wirfs | OT | 1 | 0.0 | 0.0% | 1 | 100.0% | 11 | 11.0 | 1 |
| Lance McCutcheon | WR | 1 | 0.0 | 0.0% | 0 | 0.0% | 0 | 0.0 | 0 |
| Johnny Stanton | RB | 1 | 0.0 | 0.0% | 1 | 100.0% | 6 | 6.0 | 0 |
| Stephen Sullivan | TE | 1 | 0.0 | 0.0% | 1 | 100.0% | 13 | 13.0 | 0 |
Built from the 83 games Baker Mayfield threw a pass in (team totals in games where more than one QB attempted a pass).