



























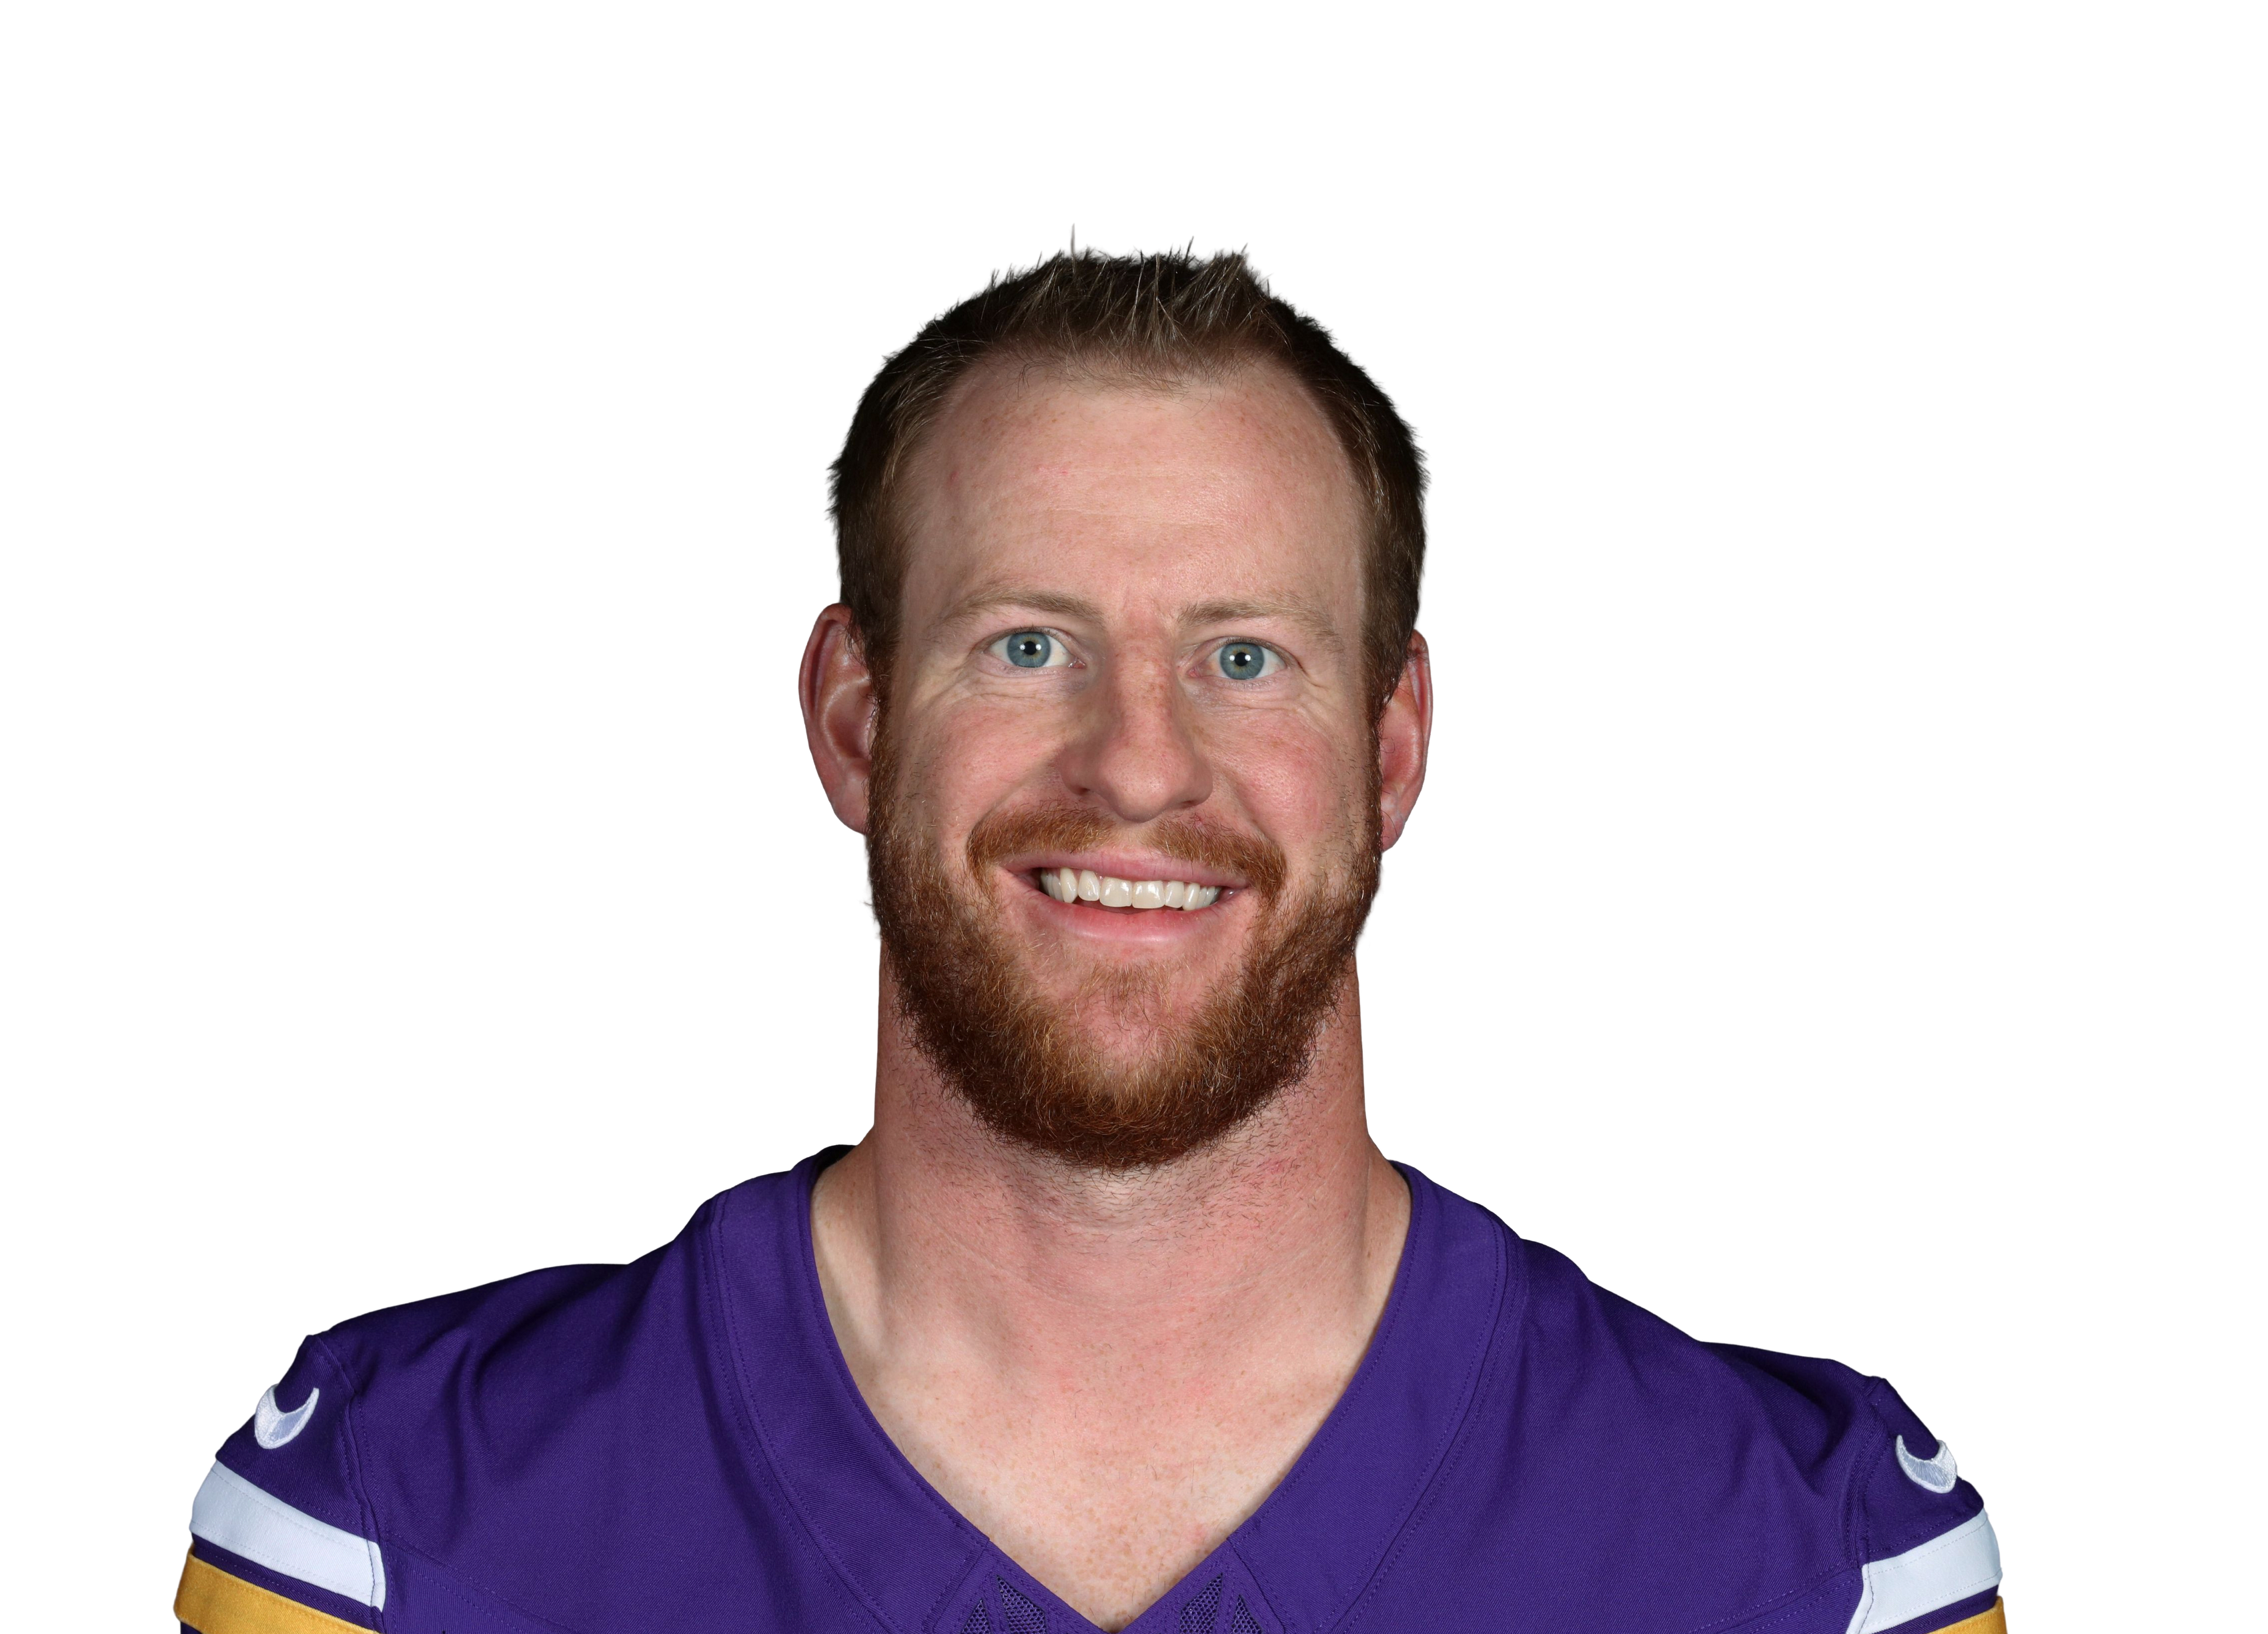
Carson Wentz #11
QB
Active
Season Stats
Game Log
Career
Prop Stats
QB Analysis
Rushing Attempts
Rushing Yards
Pass Completions
Pass Attempts
Practice
News
Carson Wentz vs All Teams
No Hard Rock Bet passing-yards line for his next game yet — hit-rate cards appear once Hard Rock posts it.
202.6
Avg Passing Yards
62.9%
Completion %
12.0
Avg Rush Yards
1.4
Avg TDs
Target Distribution
| Player | Position | Targets | Avg per Game | Target % | Completions | Comp % | Total Yards | Yards/Target | TDs |
|---|---|---|---|---|---|---|---|---|---|
| Michael Pittman | WR | 129 | 3.7 | 11.9% | 88 | 68.2% | 1082 | 8.4 | 6 |
| Zach Pascal | WR | 69 | 2.0 | 6.4% | 38 | 55.1% | 384 | 5.6 | 3 |
| Justin Jefferson | WR | 65 | 1.9 | 6.0% | 45 | 69.2% | 624 | 9.6 | 2 |
| Curtis Samuel | WR | 57 | 1.6 | 5.3% | 40 | 70.2% | 345 | 6.1 | 3 |
| Nyheim Hines | RB | 57 | 1.6 | 5.3% | 40 | 70.2% | 310 | 5.4 | 1 |
| Jonathan Taylor | RB | 51 | 1.5 | 4.7% | 40 | 78.4% | 360 | 7.1 | 2 |
| Terry McLaurin | WR | 47 | 1.3 | 4.4% | 28 | 59.6% | 469 | 10.0 | 2 |
| Mo Alie-Cox | TE | 45 | 1.3 | 4.2% | 24 | 53.3% | 316 | 7.0 | 4 |
| Jack Doyle | TE | 43 | 1.2 | 4.0% | 29 | 67.4% | 302 | 7.0 | 3 |
| T.J. Hockenson | TE | 38 | 1.1 | 3.5% | 30 | 78.9% | 260 | 6.8 | 2 |
| Jahan Dotson | WR | 38 | 1.1 | 3.5% | 21 | 55.3% | 265 | 7.0 | 5 |
| T.Y. Hilton | WR | 37 | 1.1 | 3.4% | 23 | 62.2% | 331 | 8.9 | 3 |
| Jordan Addison | WR | 37 | 1.1 | 3.4% | 23 | 62.2% | 330 | 8.9 | 2 |
| Logan Thomas | TE | 35 | 1.0 | 3.2% | 25 | 71.4% | 197 | 5.6 | 1 |
| J.D. McKissic | RB | 33 | 0.9 | 3.1% | 24 | 72.7% | 159 | 4.8 | 0 |
| Antonio Gibson | RB | 27 | 0.8 | 2.5% | 21 | 77.8% | 173 | 6.4 | 0 |
| Ashton Dulin | WR | 22 | 0.6 | 2.0% | 13 | 59.1% | 173 | 7.9 | 2 |
| Parris Campbell | WR | 20 | 0.6 | 1.9% | 10 | 50.0% | 162 | 8.1 | 1 |
| Jalen Nailor | WR | 18 | 0.5 | 1.7% | 9 | 50.0% | 103 | 5.7 | 1 |
| Kylen Granson | TE | 15 | 0.4 | 1.4% | 11 | 73.3% | 106 | 7.1 | 0 |
| John Bates | TE | 14 | 0.4 | 1.3% | 9 | 64.3% | 73 | 5.2 | 0 |
| Zavier Scott | RB | 12 | 0.3 | 1.1% | 10 | 83.3% | 73 | 6.1 | 1 |
| Xavier Worthy | WR | 11 | 0.3 | 1.0% | 6 | 54.5% | 46 | 4.2 | 0 |
| Josh Oliver | TE | 11 | 0.3 | 1.0% | 7 | 63.6% | 102 | 9.3 | 2 |
| Dyami Brown | WR | 9 | 0.3 | 0.8% | 3 | 33.3% | 111 | 12.3 | 2 |
| Jonathan Williams | RB | 8 | 0.2 | 0.7% | 5 | 62.5% | 31 | 3.9 | 0 |
| Travis Kelce | TE | 8 | 0.2 | 0.7% | 4 | 50.0% | 27 | 3.4 | 0 |
| Cam Sims | WR | 8 | 0.2 | 0.7% | 3 | 37.5% | 29 | 3.6 | 0 |
| Adam Thielen | WR | 8 | 0.2 | 0.7% | 3 | 37.5% | 21 | 2.6 | 0 |
| Jordan Mason | RB | 8 | 0.2 | 0.7% | 7 | 87.5% | 22 | 2.8 | 0 |
| Nikko Remigio | WR | 6 | 0.2 | 0.6% | 2 | 33.3% | 48 | 8.0 | 0 |
| Noah Gray | TE | 6 | 0.2 | 0.6% | 3 | 50.0% | 22 | 3.7 | 1 |
| DeAndre Hopkins | WR | 6 | 0.2 | 0.6% | 5 | 83.3% | 36 | 6.0 | 0 |
| Puka Nacua | WR | 6 | 0.2 | 0.6% | 4 | 66.7% | 41 | 6.8 | 1 |
| Aaron Jones | RB | 5 | 0.1 | 0.5% | 2 | 40.0% | 15 | 3.0 | 0 |
| Marlon Mack | RB | 5 | 0.1 | 0.5% | 2 | 40.0% | 8 | 1.6 | 0 |
| Cole Turner | TE | 5 | 0.1 | 0.5% | 2 | 40.0% | 23 | 4.6 | 0 |
| JuJu Smith-Schuster | WR | 5 | 0.1 | 0.5% | 2 | 40.0% | 11 | 2.2 | 1 |
| Dezmon Patmon | WR | 4 | 0.1 | 0.4% | 2 | 50.0% | 21 | 5.3 | 1 |
| Justin Watson | WR | 4 | 0.1 | 0.4% | 1 | 25.0% | 5 | 1.3 | 0 |
| Davis Allen | TE | 4 | 0.1 | 0.4% | 4 | 100.0% | 25 | 6.3 | 0 |
| Tutu Atwell | WR | 4 | 0.1 | 0.4% | 2 | 50.0% | 7 | 1.8 | 0 |
| Dax Milne | WR | 4 | 0.1 | 0.4% | 3 | 75.0% | 23 | 5.8 | 0 |
| Mike Strachan | WR | 3 | 0.1 | 0.3% | 2 | 66.7% | 26 | 8.7 | 0 |
| Brycen Hopkins | TE | 3 | 0.1 | 0.3% | 2 | 66.7% | 47 | 15.7 | 0 |
| Tyler Johnson | WR | 3 | 0.1 | 0.3% | 2 | 66.7% | 8 | 2.7 | 1 |
| Carson Steele | RB | 2 | 0.1 | 0.2% | 2 | 100.0% | 2 | 1.0 | 0 |
| Peyton Hendershot | TE | 2 | 0.1 | 0.2% | 2 | 100.0% | 25 | 12.5 | 0 |
| Ben Yurosek | TE | 2 | 0.1 | 0.2% | 1 | 50.0% | 5 | 2.5 | 0 |
| DeeJay Dallas | RB | 2 | 0.1 | 0.2% | 2 | 100.0% | 13 | 6.5 | 0 |
| Ben Skowronek | WR | 2 | 0.1 | 0.2% | 2 | 100.0% | 22 | 11.0 | 0 |
| Brian Robinson | RB | 2 | 0.1 | 0.2% | 0 | 0.0% | 0 | 0.0 | 0 |
| Kareem Hunt | RB | 2 | 0.1 | 0.2% | 1 | 50.0% | 4 | 2.0 | 0 |
| Samaje Perine | RB | 2 | 0.1 | 0.2% | 2 | 100.0% | 36 | 18.0 | 0 |
| Cam Akers | RB | 1 | 0.0 | 0.1% | 0 | 0.0% | 0 | 0.0 | 0 |
| C.J. Ham | FB | 1 | 0.0 | 0.1% | 1 | 100.0% | 5 | 5.0 | 0 |
| Demond Claiborne | RB | 1 | 0.0 | 0.1% | 1 | 100.0% | 2 | 2.0 | 0 |
| Armani Rogers | TE | 1 | 0.0 | 0.1% | 1 | 100.0% | 23 | 23.0 | 0 |
| Royce Freeman | RB | 1 | 0.0 | 0.1% | 1 | 100.0% | 13 | 13.0 | 0 |
| Tai Felton | WR | 1 | 0.0 | 0.1% | 1 | 100.0% | 9 | 9.0 | 0 |
| Danny Pinter | G | 1 | 0.0 | 0.1% | 1 | 100.0% | 2 | 2.0 | 1 |
| Myles Price | WR | 1 | 0.0 | 0.1% | 0 | 0.0% | 0 | 0.0 | 0 |
| Isiah Pacheco | RB | 1 | 0.0 | 0.1% | 1 | 100.0% | 15 | 15.0 | 0 |
| Jauan Jennings | WR | 1 | 0.0 | 0.1% | 0 | 0.0% | 0 | 0.0 | 0 |
| Keke Coutee | WR | 1 | 0.0 | 0.1% | 1 | 100.0% | 5 | 5.0 | 0 |
Built from the 35 games Carson Wentz threw a pass in (team totals in games where more than one QB attempted a pass).