



























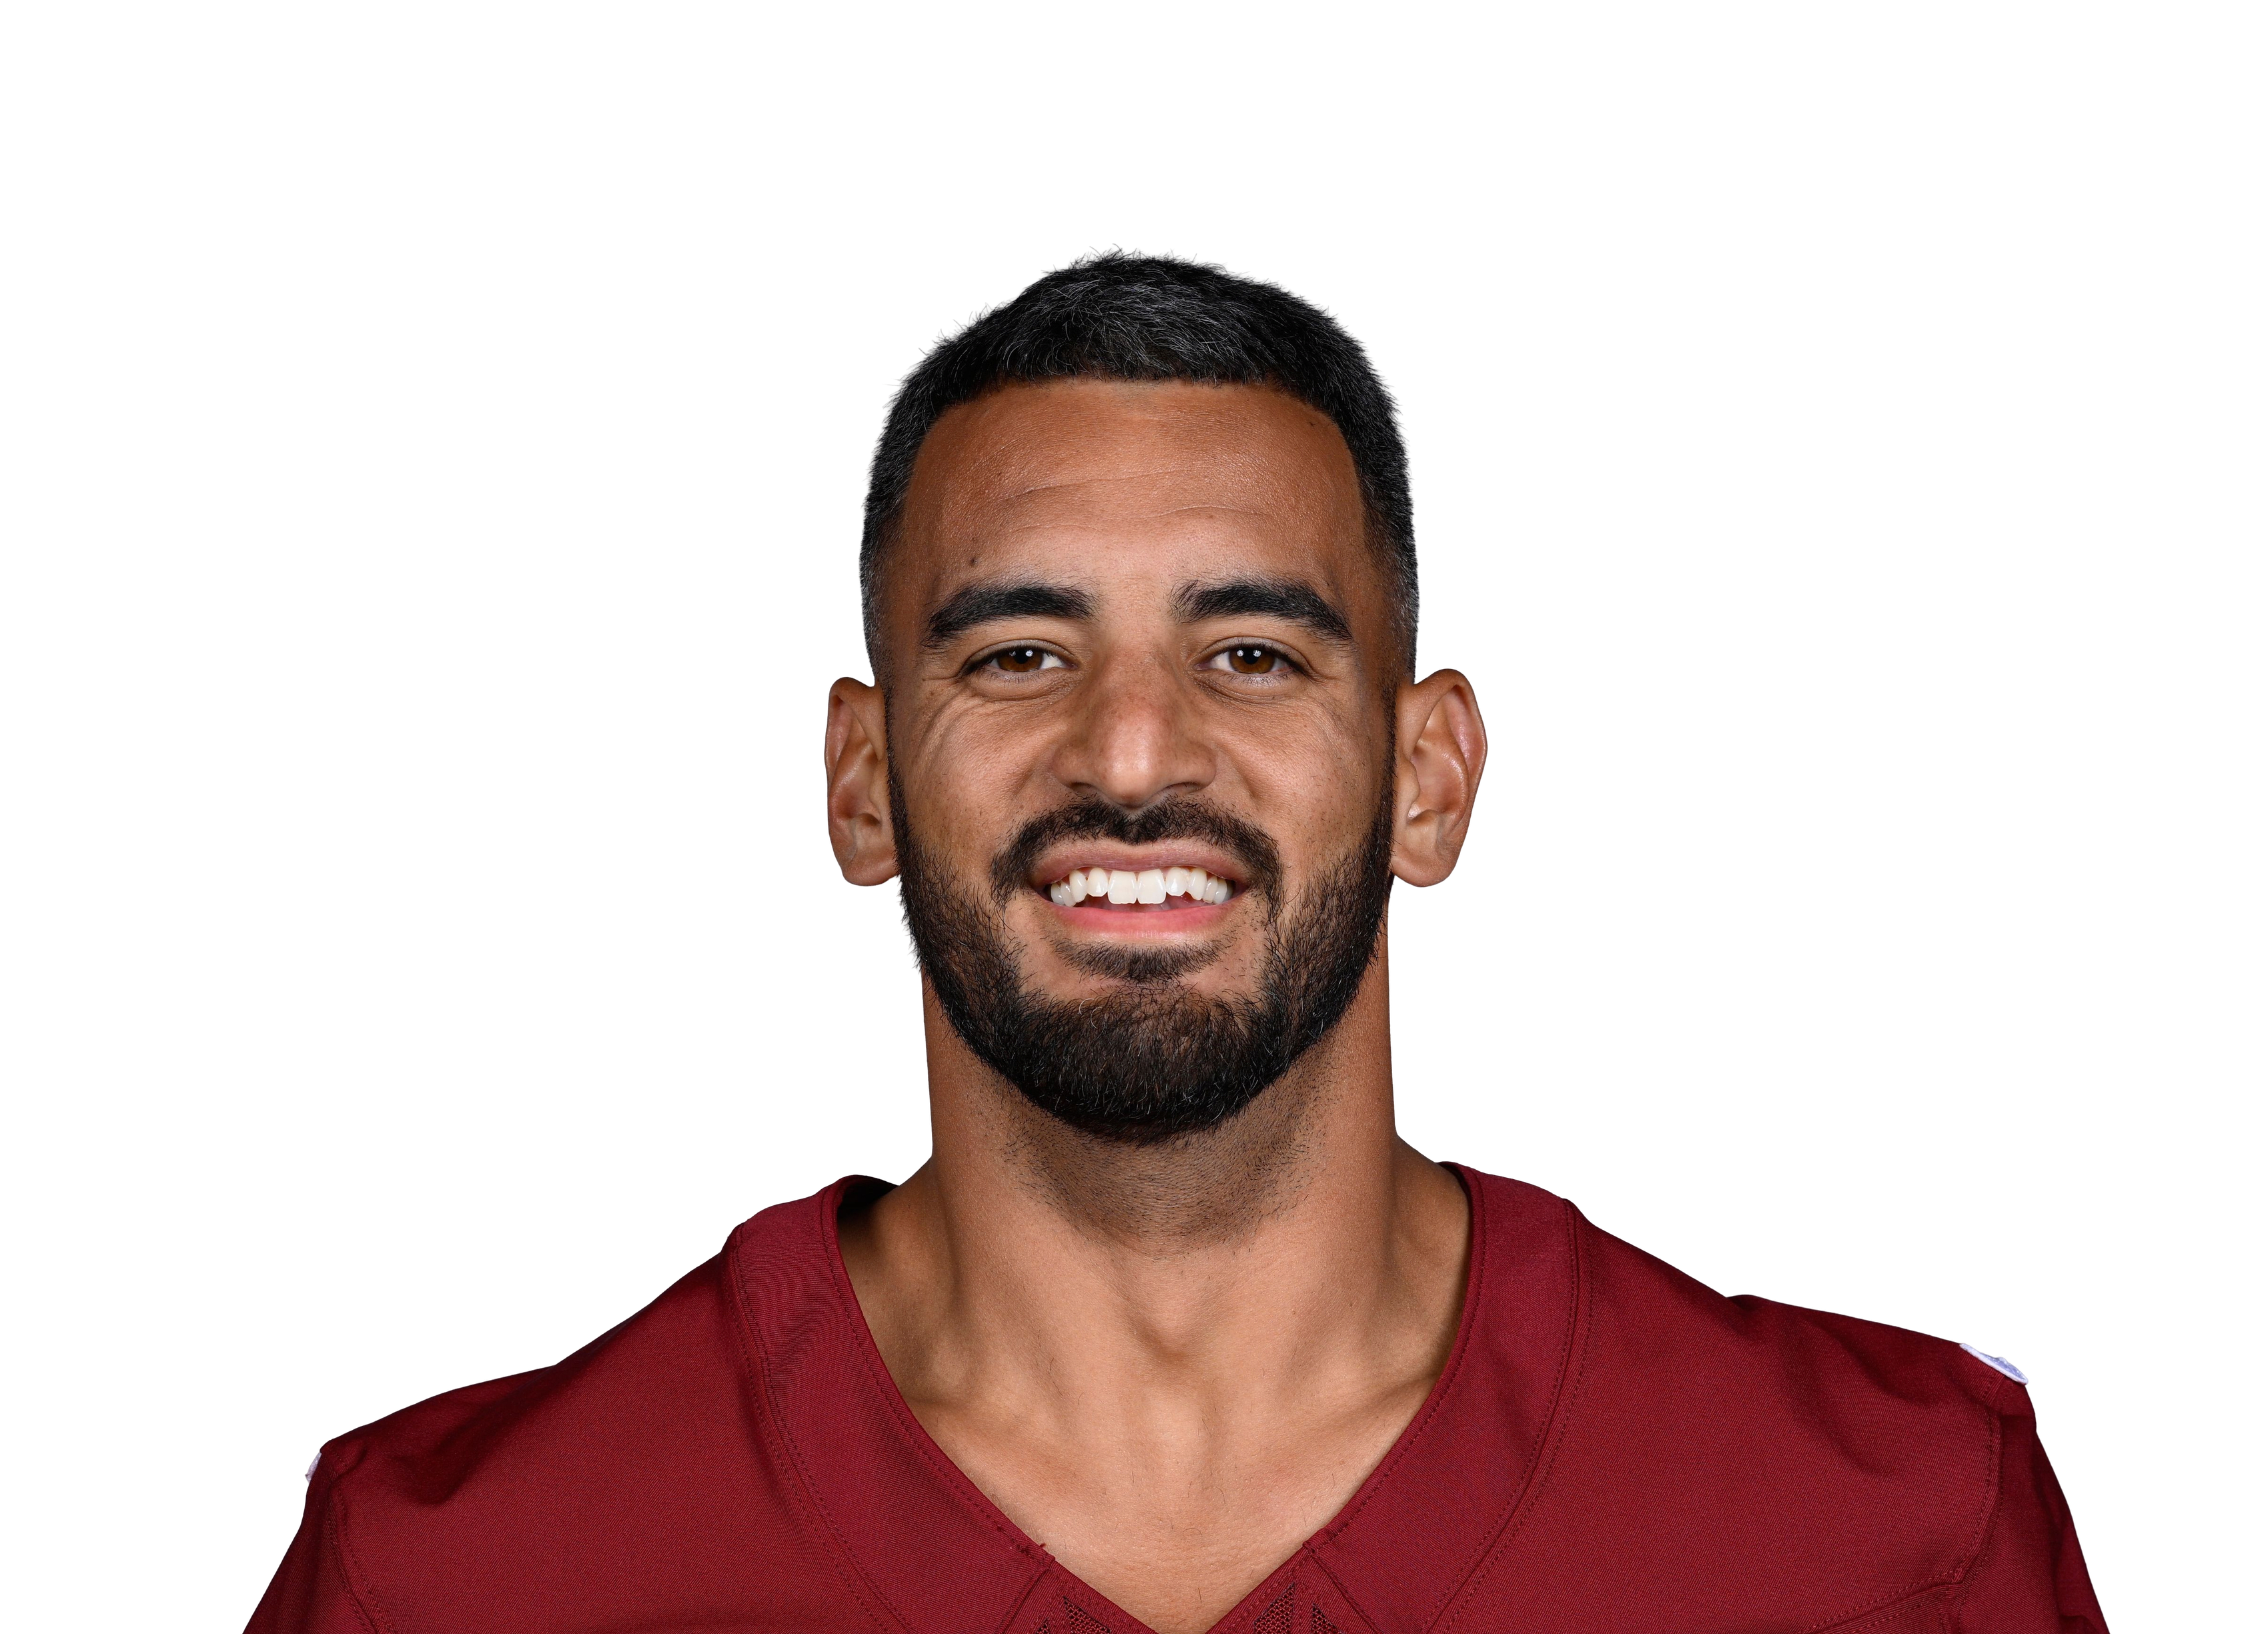
Marcus Mariota #8
QB
Inactive
Season Stats
Game Log
Career
Prop Stats
QB Analysis
Rushing Attempts
Rushing Yards
Pass Completions
Pass Attempts
Practice
News
Marcus Mariota vs All Teams
No Hard Rock Bet passing-yards line for his next game yet — hit-rate cards appear once Hard Rock posts it.
145.0
Avg Passing Yards
62.8%
Completion %
29.3
Avg Rush Yards
1.0
Avg TDs
Target Distribution
| Player | Position | Targets | Avg per Game | Target % | Completions | Comp % | Total Yards | Yards/Target | TDs |
|---|---|---|---|---|---|---|---|---|---|
| Drake London | WR | 81 | 2.5 | 9.3% | 47 | 58.0% | 533 | 6.6 | 4 |
| Terry McLaurin | WR | 80 | 2.4 | 9.2% | 48 | 60.0% | 786 | 9.8 | 5 |
| Zach Ertz | TE | 66 | 2.0 | 7.6% | 42 | 63.6% | 419 | 6.3 | 3 |
| Olamide Zaccheaus | WR | 62 | 1.9 | 7.2% | 41 | 66.1% | 584 | 9.4 | 2 |
| Kyle Pitts | TE | 59 | 1.8 | 6.8% | 28 | 47.5% | 356 | 6.0 | 2 |
| Deebo Samuel Sr. | WR | 50 | 1.5 | 5.8% | 37 | 74.0% | 366 | 7.3 | 3 |
| Stefon Diggs | WR | 22 | 0.7 | 2.5% | 14 | 63.6% | 115 | 5.2 | 2 |
| Jeremy McNichols | RB | 21 | 0.6 | 2.4% | 17 | 81.0% | 134 | 6.4 | 0 |
| Treylon Burks | WR | 21 | 0.6 | 2.4% | 9 | 42.9% | 153 | 7.3 | 3 |
| Dyami Brown | WR | 20 | 0.6 | 2.3% | 13 | 65.0% | 182 | 9.1 | 1 |
| KhaDarel Hodge | WR | 19 | 0.6 | 2.2% | 12 | 63.2% | 197 | 10.4 | 1 |
| Zay Jones | WR | 18 | 0.5 | 2.1% | 13 | 72.2% | 147 | 8.2 | 0 |
| Jaylin Lane | WR | 18 | 0.5 | 2.1% | 10 | 55.6% | 151 | 8.4 | 0 |
| Damiere Byrd | WR | 17 | 0.5 | 2.0% | 10 | 58.8% | 241 | 14.2 | 2 |
| Cordarrelle Patterson | RB | 16 | 0.5 | 1.8% | 11 | 68.8% | 65 | 4.1 | 0 |
| Chris Moore | WR | 15 | 0.5 | 1.7% | 6 | 40.0% | 112 | 7.5 | 0 |
| Quez Watkins | WR | 15 | 0.5 | 1.7% | 11 | 73.3% | 121 | 8.1 | 1 |
| Antonio Williams | WR | 15 | 0.5 | 1.7% | 8 | 53.3% | 60 | 4.0 | 0 |
| Hunter Renfrow | WR | 14 | 0.4 | 1.6% | 11 | 78.6% | 89 | 6.4 | 3 |
| A.J. Brown | WR | 14 | 0.4 | 1.6% | 9 | 64.3% | 123 | 8.8 | 0 |
| Luke McCaffrey | WR | 14 | 0.4 | 1.6% | 11 | 78.6% | 120 | 8.6 | 2 |
| Jacory Croskey-Merritt | RB | 13 | 0.4 | 1.5% | 9 | 69.2% | 66 | 5.1 | 0 |
| Bryan Edwards | WR | 12 | 0.4 | 1.4% | 7 | 58.3% | 78 | 6.5 | 0 |
| DeVonta Smith | WR | 11 | 0.3 | 1.3% | 9 | 81.8% | 96 | 8.7 | 1 |
| John Bates | TE | 11 | 0.3 | 1.3% | 7 | 63.6% | 70 | 6.4 | 0 |
| Ben Sinnott | TE | 10 | 0.3 | 1.2% | 8 | 80.0% | 87 | 8.7 | 2 |
| Tyler Allgeier | RB | 10 | 0.3 | 1.2% | 10 | 100.0% | 87 | 8.7 | 1 |
| Robbie Chosen | WR | 9 | 0.3 | 1.0% | 5 | 55.6% | 53 | 5.9 | 0 |
| Parker Hesse | TE | 9 | 0.3 | 1.0% | 7 | 77.8% | 75 | 8.3 | 0 |
| Avery Williams | RB | 9 | 0.3 | 1.0% | 8 | 88.9% | 35 | 3.9 | 0 |
| Darren Waller | TE | 9 | 0.3 | 1.0% | 2 | 22.2% | 22 | 2.4 | 0 |
| MyCole Pruitt | TE | 8 | 0.2 | 0.9% | 7 | 87.5% | 47 | 5.9 | 3 |
| Austin Ekeler | RB | 8 | 0.2 | 0.9% | 7 | 87.5% | 64 | 8.0 | 0 |
| Colson Yankoff | TE | 7 | 0.2 | 0.8% | 4 | 57.1% | 34 | 4.9 | 0 |
| Rachaad White | RB | 7 | 0.2 | 0.8% | 7 | 100.0% | 46 | 6.6 | 1 |
| Kenny Gainwell | RB | 7 | 0.2 | 0.8% | 5 | 71.4% | 42 | 6.0 | 0 |
| Anthony Firkser | TE | 7 | 0.2 | 0.8% | 6 | 85.7% | 79 | 11.3 | 0 |
| Josh Jacobs | RB | 6 | 0.2 | 0.7% | 6 | 100.0% | 29 | 4.8 | 0 |
| D'Andre Swift | RB | 6 | 0.2 | 0.7% | 2 | 33.3% | 7 | 1.2 | 0 |
| Britain Covey | WR | 5 | 0.2 | 0.6% | 3 | 60.0% | 35 | 7.0 | 0 |
| Chig Okonkwo | TE | 4 | 0.1 | 0.5% | 2 | 50.0% | 5 | 1.3 | 0 |
| Julio Jones | WR | 4 | 0.1 | 0.5% | 2 | 50.0% | 13 | 3.3 | 0 |
| Noah Brown | WR | 4 | 0.1 | 0.5% | 3 | 75.0% | 63 | 15.8 | 0 |
| Dallas Goedert | TE | 3 | 0.1 | 0.3% | 1 | 33.3% | 4 | 1.3 | 0 |
| DeSean Jackson | WR | 3 | 0.1 | 0.3% | 1 | 33.3% | 5 | 1.7 | 0 |
| Foster Moreau | TE | 3 | 0.1 | 0.3% | 3 | 100.0% | 59 | 19.7 | 0 |
| Chris Rodriguez Jr. | RB | 3 | 0.1 | 0.3% | 2 | 66.7% | 12 | 4.0 | 0 |
| Jalen Richard | RB | 3 | 0.1 | 0.3% | 3 | 100.0% | 22 | 7.3 | 0 |
| Feleipe Franks | TE | 2 | 0.1 | 0.2% | 0 | 0.0% | 0 | 0.0 | 0 |
| Keith Smith | FB | 2 | 0.1 | 0.2% | 1 | 50.0% | 8 | 4.0 | 0 |
| Boston Scott | RB | 2 | 0.1 | 0.2% | 1 | 50.0% | 27 | 13.5 | 0 |
| Grant Calcaterra | TE | 2 | 0.1 | 0.2% | 2 | 100.0% | 18 | 9.0 | 0 |
| Peyton Barber | RB | 2 | 0.1 | 0.2% | 2 | 100.0% | 9 | 4.5 | 0 |
| Caleb Huntley | RB | 2 | 0.1 | 0.2% | 2 | 100.0% | 3 | 1.5 | 0 |
| Jacoby Jones | WR | 1 | 0.0 | 0.1% | 1 | 100.0% | 25 | 25.0 | 0 |
| Brycen Tremayne | WR | 1 | 0.0 | 0.1% | 1 | 100.0% | -2 | -2.0 | 0 |
| Jack Stoll | TE | 1 | 0.0 | 0.1% | 1 | 100.0% | 11 | 11.0 | 0 |
| Brian Robinson | RB | 1 | 0.0 | 0.1% | 1 | 100.0% | 6 | 6.0 | 0 |
| Albert Okwuegbunam | TE | 1 | 0.0 | 0.1% | 0 | 0.0% | 0 | 0.0 | 0 |
| Brandon Coleman | G | 1 | 0.0 | 0.1% | 1 | 100.0% | 13 | 13.0 | 0 |
| Tay Martin | WR | 1 | 0.0 | 0.1% | 1 | 100.0% | 14 | 14.0 | 0 |
Built from the 33 games Marcus Mariota threw a pass in (team totals in games where more than one QB attempted a pass).