



























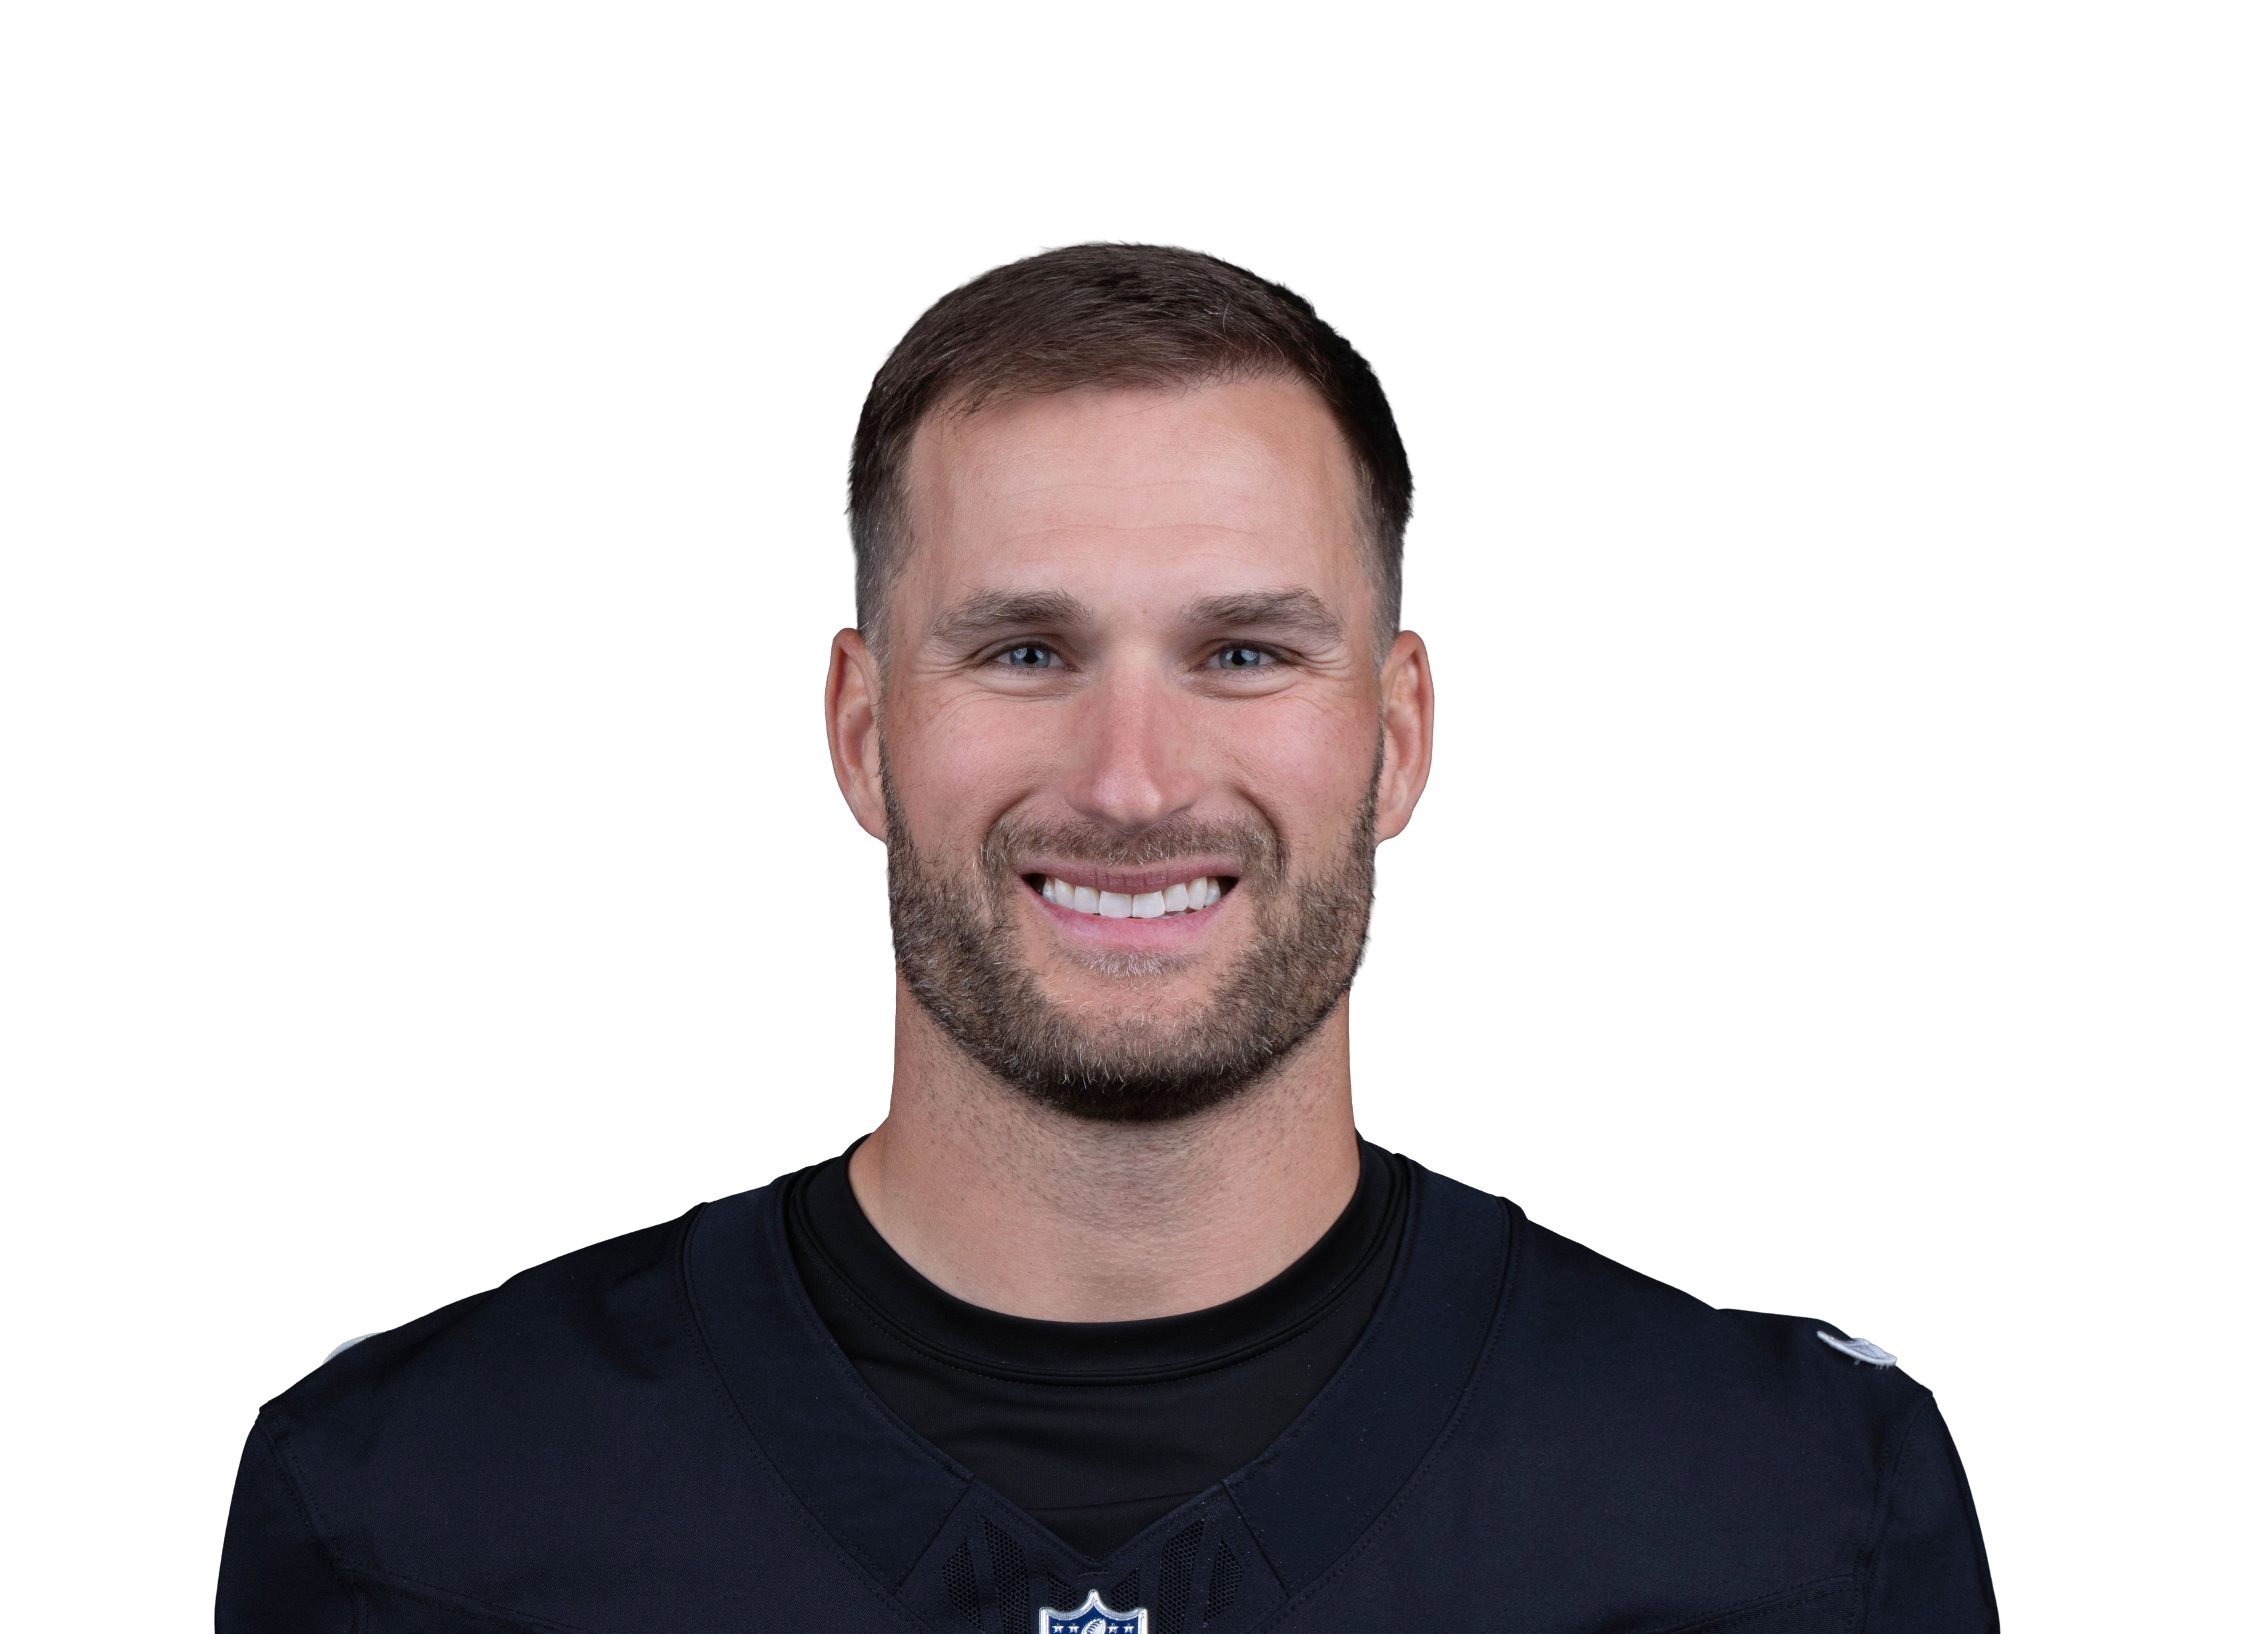
Kirk Cousins #8
QB
Active
Season Stats
Game Log
Career
Prop Stats
QB Analysis
Rushing Attempts
Rushing Yards
Pass Completions
Pass Attempts
Practice
News
Kirk Cousins vs All Teams
No Hard Rock Bet passing-yards line for his next game yet — hit-rate cards appear once Hard Rock posts it.
252.5
Avg Passing Yards
66.2%
Completion %
3.4
Avg Rush Yards
1.7
Avg TDs
Target Distribution
| Player | Position | Targets | Avg per Game | Target % | Completions | Comp % | Total Yards | Yards/Target | TDs |
|---|---|---|---|---|---|---|---|---|---|
| Justin Jefferson | WR | 402 | 5.6 | 16.2% | 273 | 67.9% | 3985 | 9.9 | 21 |
| K.J. Osborn | WR | 217 | 3.0 | 8.7% | 139 | 64.1% | 1635 | 7.5 | 14 |
| Adam Thielen | WR | 206 | 2.9 | 8.3% | 140 | 68.0% | 1492 | 7.2 | 16 |
| T.J. Hockenson | TE | 165 | 2.3 | 6.6% | 123 | 74.5% | 1126 | 6.8 | 6 |
| Drake London | WR | 154 | 2.1 | 6.2% | 98 | 63.6% | 1202 | 7.8 | 8 |
| Darnell Mooney | WR | 147 | 2.0 | 5.9% | 81 | 55.1% | 1181 | 8.0 | 6 |
| Kyle Pitts | TE | 138 | 1.9 | 5.6% | 96 | 69.6% | 1142 | 8.3 | 7 |
| Bijan Robinson | RB | 118 | 1.6 | 4.8% | 98 | 83.1% | 826 | 7.0 | 3 |
| Dalvin Cook | RB | 109 | 1.5 | 4.4% | 76 | 69.7% | 529 | 4.9 | 2 |
| Alexander Mattison | RB | 85 | 1.2 | 3.4% | 65 | 76.5% | 417 | 4.9 | 4 |
| Ray-Ray McCloud | WR | 80 | 1.1 | 3.2% | 56 | 70.0% | 608 | 7.6 | 1 |
| Tyler Conklin | TE | 78 | 1.1 | 3.1% | 56 | 71.8% | 546 | 7.0 | 3 |
| Jordan Addison | WR | 52 | 0.7 | 2.1% | 36 | 69.2% | 482 | 9.3 | 7 |
| Brock Bowers | TE | 43 | 0.6 | 1.7% | 28 | 65.1% | 382 | 8.9 | 3 |
| Irv Smith | TE | 38 | 0.5 | 1.5% | 26 | 68.4% | 185 | 4.9 | 3 |
| Ashton Jeanty | RB | 36 | 0.5 | 1.5% | 26 | 72.2% | 251 | 7.0 | 2 |
| Tre Tucker | WR | 35 | 0.5 | 1.4% | 24 | 68.6% | 371 | 10.6 | 3 |
| Michael Mayer | TE | 34 | 0.5 | 1.4% | 28 | 82.4% | 266 | 7.8 | 1 |
| David Sills | WR | 34 | 0.5 | 1.4% | 18 | 52.9% | 191 | 5.6 | 2 |
| C.J. Ham | FB | 33 | 0.5 | 1.3% | 30 | 90.9% | 226 | 6.8 | 0 |
| Jalen Nailor | WR | 28 | 0.4 | 1.1% | 15 | 53.6% | 240 | 8.6 | 1 |
| Johnny Mundt | TE | 24 | 0.3 | 1.0% | 22 | 91.7% | 171 | 7.1 | 1 |
| Tyler Allgeier | RB | 24 | 0.3 | 1.0% | 22 | 91.7% | 148 | 6.2 | 0 |
| Brandon Powell | WR | 19 | 0.3 | 0.8% | 13 | 68.4% | 142 | 7.5 | 0 |
| Cody White | WR | 16 | 0.2 | 0.6% | 7 | 43.8% | 108 | 6.8 | 3 |
| Charlie Woerner | TE | 16 | 0.2 | 0.6% | 13 | 81.3% | 74 | 4.6 | 0 |
| KhaDarel Hodge | WR | 15 | 0.2 | 0.6% | 8 | 53.3% | 129 | 8.6 | 1 |
| Dede Westbrook | WR | 14 | 0.2 | 0.6% | 9 | 64.3% | 64 | 4.6 | 0 |
| Jalen Reagor | WR | 13 | 0.2 | 0.5% | 8 | 61.5% | 104 | 8.0 | 1 |
| Josh Oliver | TE | 12 | 0.2 | 0.5% | 10 | 83.3% | 70 | 5.8 | 1 |
| Dylan Drummond | WR | 11 | 0.2 | 0.4% | 7 | 63.6% | 42 | 3.8 | 0 |
| Cam Akers | RB | 9 | 0.1 | 0.4% | 8 | 88.9% | 57 | 6.3 | 0 |
| Malik Benson | WR | 8 | 0.1 | 0.3% | 2 | 25.0% | 12 | 1.5 | 0 |
| Chris Herndon | TE | 7 | 0.1 | 0.3% | 4 | 57.1% | 40 | 5.7 | 1 |
| Kene Nwangwu | RB | 7 | 0.1 | 0.3% | 6 | 85.7% | 30 | 4.3 | 0 |
| Ty Chandler | RB | 6 | 0.1 | 0.2% | 5 | 83.3% | 43 | 7.2 | 0 |
| Ihmir Smith-Marsette | WR | 6 | 0.1 | 0.2% | 5 | 83.3% | 116 | 19.3 | 2 |
| Jack Bech | WR | 6 | 0.1 | 0.2% | 5 | 83.3% | 48 | 8.0 | 1 |
| Mike Washington Jr. | RB | 5 | 0.1 | 0.2% | 3 | 60.0% | 11 | 2.2 | 0 |
| Ben Ellefson | TE | 4 | 0.1 | 0.2% | 3 | 75.0% | 26 | 6.5 | 0 |
| Ian Thomas | TE | 4 | 0.1 | 0.2% | 4 | 100.0% | 52 | 13.0 | 1 |
| Deven Thompkins | WR | 4 | 0.1 | 0.2% | 4 | 100.0% | 35 | 8.8 | 0 |
| Dylan Laube | RB | 4 | 0.1 | 0.2% | 4 | 100.0% | 15 | 3.8 | 0 |
| Ameer Abdullah | RB | 4 | 0.1 | 0.2% | 3 | 75.0% | 17 | 4.3 | 0 |
| Casey Washington | WR | 3 | 0.0 | 0.1% | 2 | 66.7% | 39 | 13.0 | 0 |
| Dareke Young | WR | 3 | 0.0 | 0.1% | 2 | 66.7% | 36 | 12.0 | 0 |
| Luke Stocker | TE | 2 | 0.0 | 0.1% | 2 | 100.0% | 12 | 6.0 | 0 |
| Connor Heyward | FB | 1 | 0.0 | 0.0% | 1 | 100.0% | 9 | 9.0 | 0 |
| Trishton Jackson | WR | 1 | 0.0 | 0.0% | 1 | 100.0% | 7 | 7.0 | 0 |
| Jake Matthews | OT | 1 | 0.0 | 0.0% | 0 | 0.0% | 0 | 0.0 | 0 |
| Ross Dwelley | TE | 1 | 0.0 | 0.0% | 1 | 100.0% | 5 | 5.0 | 0 |
Built from the 72 games Kirk Cousins threw a pass in (team totals in games where more than one QB attempted a pass).