



























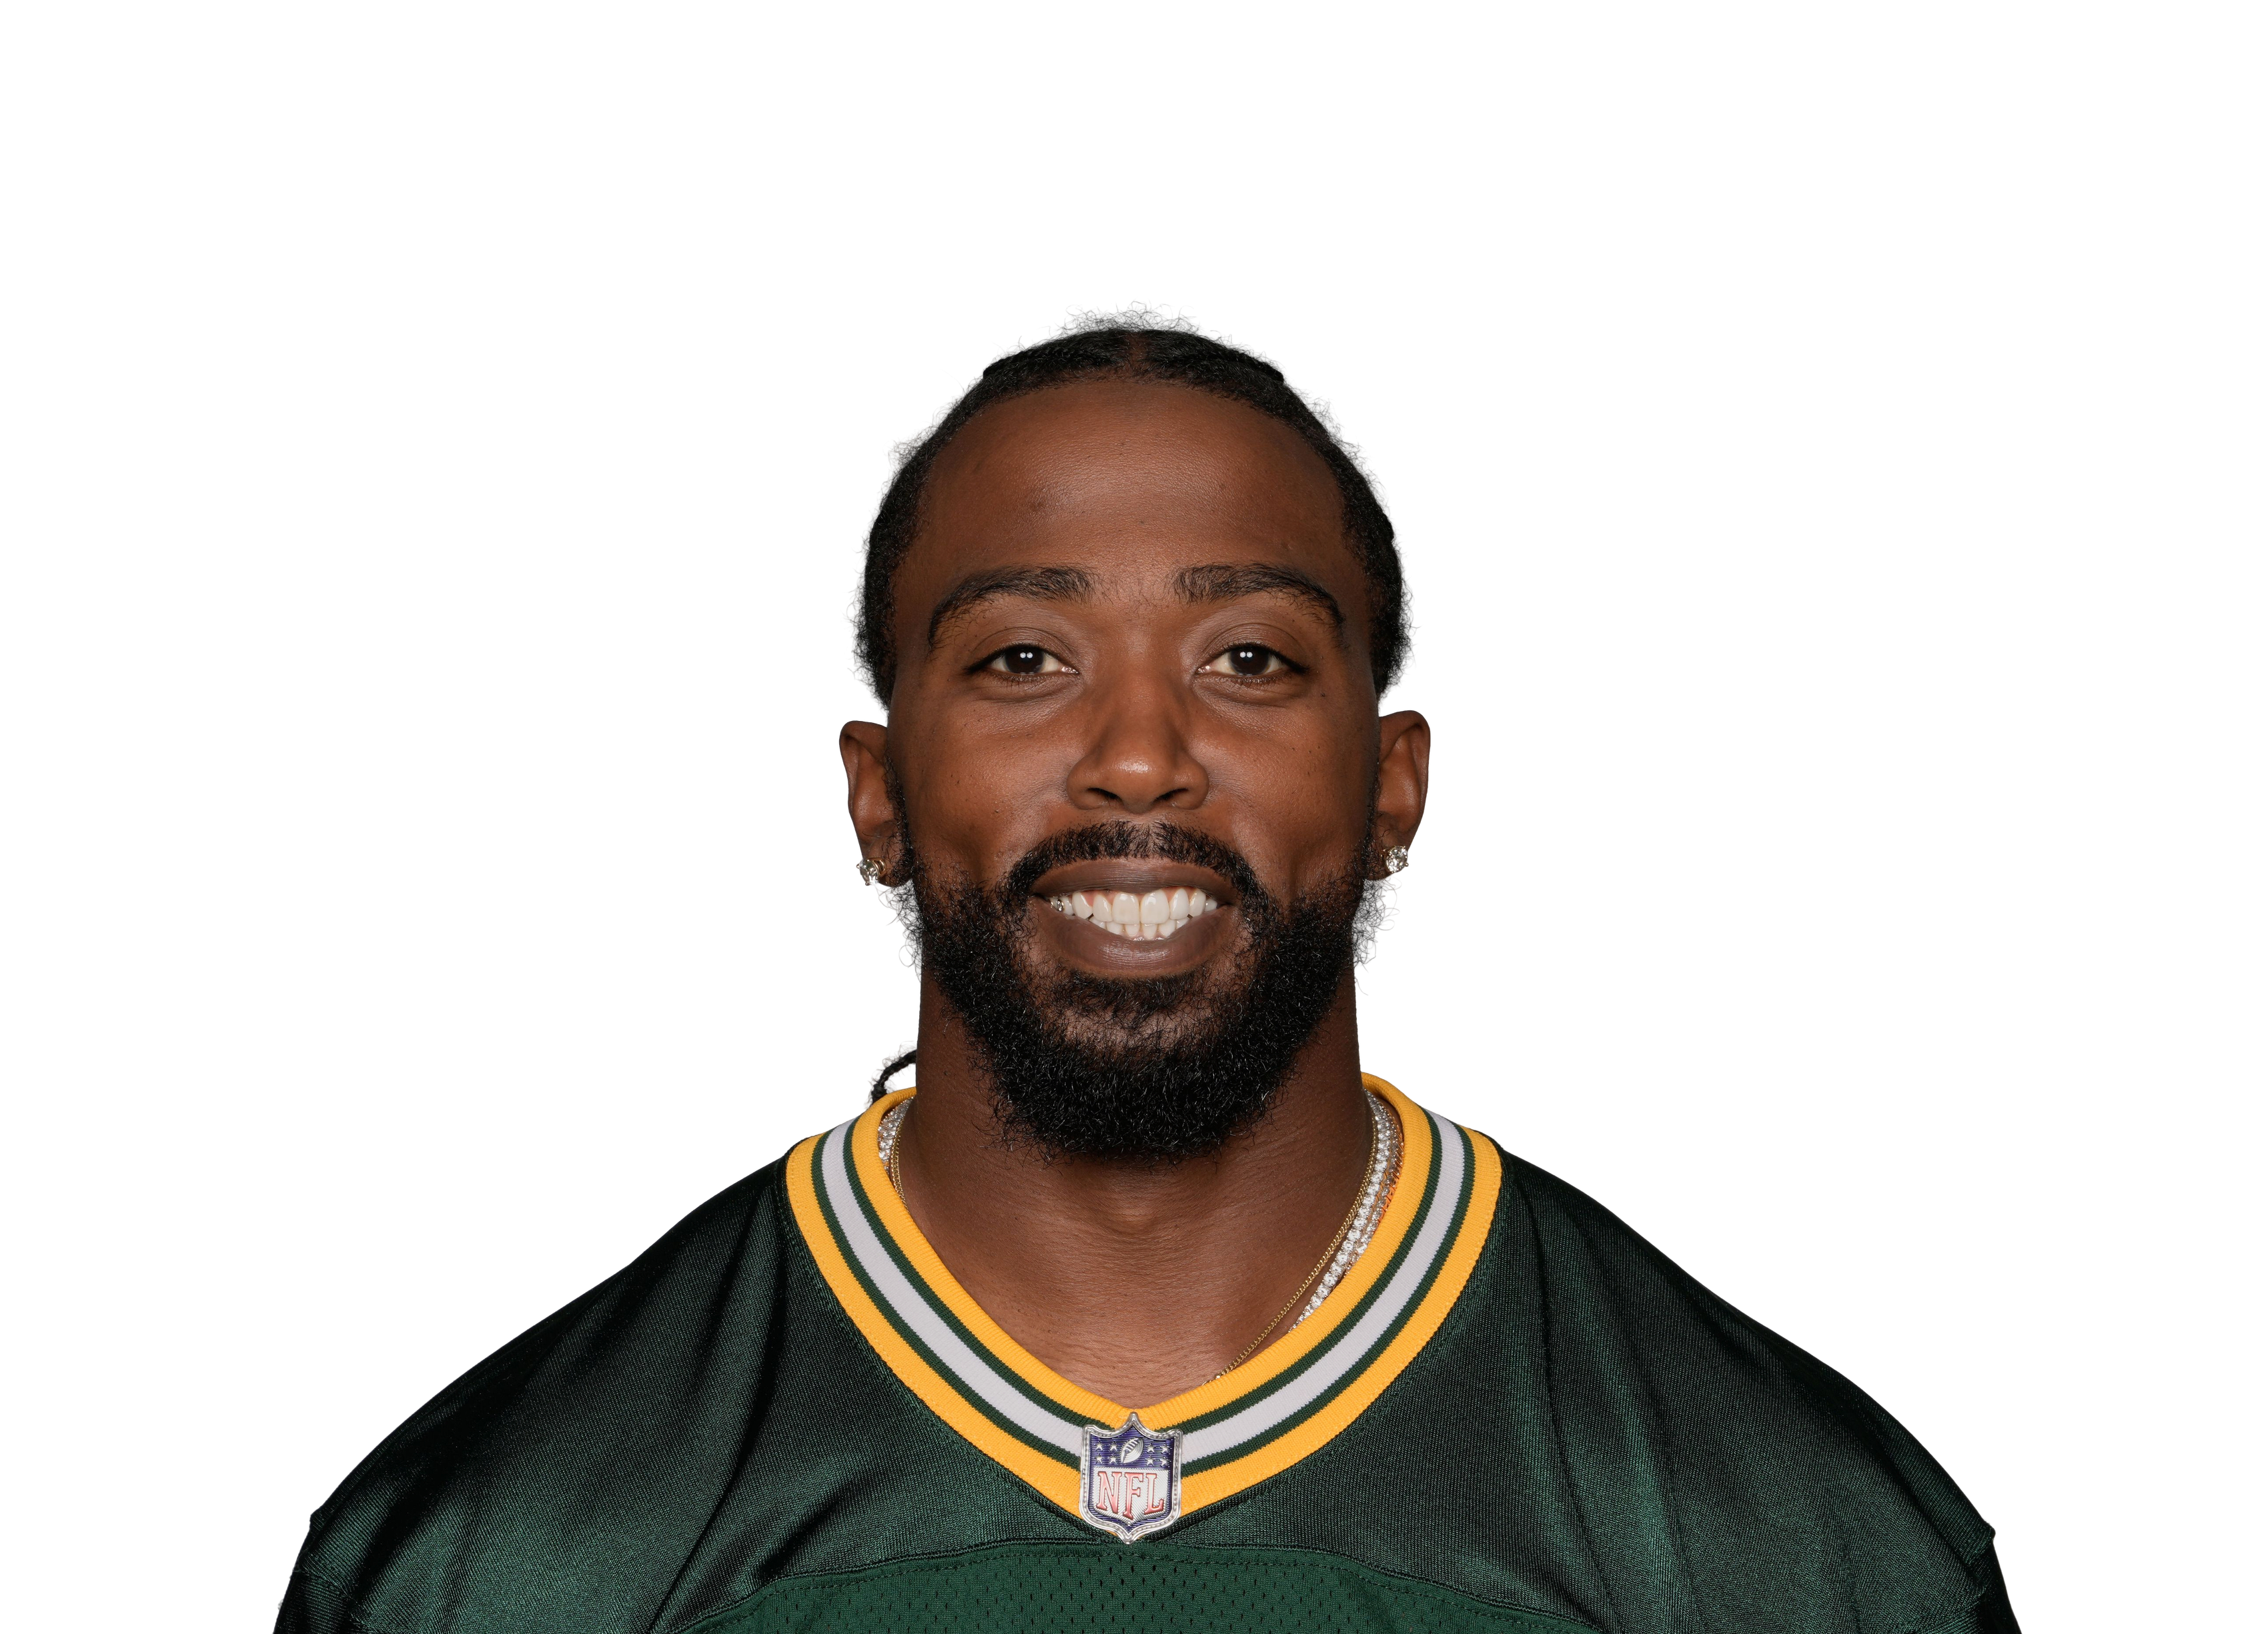
Tyrod Taylor #6
QB
Active
Season Stats
Game Log
Career
Prop Stats
QB Analysis
Rushing Attempts
Rushing Yards
Pass Completions
Pass Attempts
Practice
News
Tyrod Taylor vs All Teams
No Hard Rock Bet passing-yards line for his next game yet — hit-rate cards appear once Hard Rock posts it.
125.5
Avg Passing Yards
62.8%
Completion %
22.1
Avg Rush Yards
0.7
Avg TDs
Target Distribution
| Player | Position | Targets | Avg per Game | Target % | Completions | Comp % | Total Yards | Yards/Target | TDs |
|---|---|---|---|---|---|---|---|---|---|
| Darren Waller | TE | 63 | 2.4 | 8.4% | 43 | 68.3% | 455 | 7.2 | 1 |
| Darius Slayton | WR | 54 | 2.1 | 7.2% | 33 | 61.1% | 546 | 10.1 | 3 |
| Brandin Cooks | WR | 49 | 1.9 | 6.5% | 28 | 57.1% | 367 | 7.5 | 2 |
| Wan'Dale Robinson | WR | 48 | 1.8 | 6.4% | 36 | 75.0% | 304 | 6.3 | 0 |
| Garrett Wilson | WR | 40 | 1.5 | 5.3% | 27 | 67.5% | 260 | 6.5 | 2 |
| Saquon Barkley | RB | 38 | 1.5 | 5.1% | 27 | 71.1% | 191 | 5.0 | 1 |
| Mason Taylor | TE | 30 | 1.2 | 4.0% | 18 | 60.0% | 147 | 4.9 | 0 |
| Breece Hall | RB | 26 | 1.0 | 3.5% | 20 | 76.9% | 184 | 7.1 | 0 |
| Adonai Mitchell | WR | 25 | 1.0 | 3.3% | 11 | 44.0% | 168 | 6.7 | 1 |
| Allen Lazard | WR | 23 | 0.9 | 3.1% | 13 | 56.5% | 146 | 6.3 | 3 |
| John Metchie III | WR | 23 | 0.9 | 3.1% | 14 | 60.9% | 118 | 5.1 | 1 |
| Isaiah Hodgins | WR | 22 | 0.8 | 2.9% | 13 | 59.1% | 148 | 6.7 | 1 |
| Daniel Bellinger | TE | 21 | 0.8 | 2.8% | 19 | 90.5% | 153 | 7.3 | 0 |
| Jalin Hyatt | WR | 19 | 0.7 | 2.5% | 9 | 47.4% | 126 | 6.6 | 0 |
| Danny Amendola | WR | 19 | 0.7 | 2.5% | 12 | 63.2% | 115 | 6.1 | 1 |
| David Johnson | RB | 18 | 0.7 | 2.4% | 13 | 72.2% | 101 | 5.6 | 1 |
| Matt Breida | RB | 16 | 0.6 | 2.1% | 12 | 75.0% | 33 | 2.1 | 0 |
| Chris Conley | WR | 16 | 0.6 | 2.1% | 9 | 56.3% | 115 | 7.2 | 0 |
| Pharaoh Brown | TE | 16 | 0.6 | 2.1% | 10 | 62.5% | 100 | 6.3 | 0 |
| Nico Collins | WR | 15 | 0.6 | 2.0% | 8 | 53.3% | 101 | 6.7 | 0 |
| Brevin Jordan | TE | 12 | 0.5 | 1.6% | 8 | 66.7% | 46 | 3.8 | 1 |
| Richie James | WR | 12 | 0.5 | 1.6% | 8 | 66.7% | 70 | 5.8 | 1 |
| Parris Campbell | WR | 12 | 0.5 | 1.6% | 9 | 75.0% | 49 | 4.1 | 0 |
| Tyler Conklin | TE | 10 | 0.4 | 1.3% | 9 | 90.0% | 63 | 6.3 | 1 |
| Sterling Shepard | WR | 10 | 0.4 | 1.3% | 5 | 50.0% | 34 | 3.4 | 0 |
| Josh Reynolds | WR | 9 | 0.3 | 1.2% | 3 | 33.3% | 29 | 3.2 | 0 |
| Isaiah Davis | RB | 9 | 0.3 | 1.2% | 4 | 44.4% | 36 | 4.0 | 0 |
| Gary Brightwell | RB | 8 | 0.3 | 1.1% | 6 | 75.0% | 55 | 6.9 | 0 |
| Davante Adams | WR | 8 | 0.3 | 1.1% | 5 | 62.5% | 47 | 5.9 | 0 |
| Jordan Akins | TE | 7 | 0.3 | 0.9% | 3 | 42.9% | 24 | 3.4 | 0 |
| Eric Gray | RB | 7 | 0.3 | 0.9% | 6 | 85.7% | 22 | 3.1 | 0 |
| Jeremy Ruckert | TE | 7 | 0.3 | 0.9% | 5 | 71.4% | 36 | 5.1 | 1 |
| Tyler Johnson | WR | 7 | 0.3 | 0.9% | 5 | 71.4% | 92 | 13.1 | 0 |
| Rex Burkhead | RB | 7 | 0.3 | 0.9% | 5 | 71.4% | 48 | 6.9 | 0 |
| Arian Smith | WR | 7 | 0.3 | 0.9% | 4 | 57.1% | 10 | 1.4 | 0 |
| Isaiah Williams | WR | 4 | 0.2 | 0.5% | 2 | 50.0% | 24 | 6.0 | 0 |
| Braelon Allen | RB | 4 | 0.2 | 0.5% | 3 | 75.0% | 26 | 6.5 | 0 |
| Chris Moore | WR | 3 | 0.1 | 0.4% | 3 | 100.0% | 10 | 3.3 | 0 |
| Lawrence Cager | TE | 3 | 0.1 | 0.4% | 3 | 100.0% | 26 | 8.7 | 0 |
| Mark Ingram | RB | 3 | 0.1 | 0.4% | 1 | 33.3% | -1 | -0.3 | 0 |
| Tanner Hudson | TE | 2 | 0.1 | 0.3% | 1 | 50.0% | 18 | 9.0 | 0 |
| Andrew Beck | FB | 2 | 0.1 | 0.3% | 2 | 100.0% | 27 | 13.5 | 0 |
| Nick Vannett | TE | 2 | 0.1 | 0.3% | 1 | 50.0% | 9 | 4.5 | 0 |
| Kenny Yeboah | TE | 2 | 0.1 | 0.3% | 0 | 0.0% | 0 | 0.0 | 0 |
| David Sills | WR | 2 | 0.1 | 0.3% | 1 | 50.0% | 5 | 2.5 | 0 |
| Andre Roberts | WR | 2 | 0.1 | 0.3% | 1 | 50.0% | 35 | 17.5 | 0 |
| Antony Auclair | TE | 2 | 0.1 | 0.3% | 2 | 100.0% | 23 | 11.5 | 0 |
| Davion Davis | WR | 2 | 0.1 | 0.3% | 0 | 0.0% | 0 | 0.0 | 0 |
| Phillip Lindsay | RB | 2 | 0.1 | 0.3% | 1 | 50.0% | 22 | 11.0 | 1 |
| Jaylen Samuels | RB | 1 | 0.0 | 0.1% | 0 | 0.0% | 0 | 0.0 | 0 |
| Kenny Golladay | WR | 1 | 0.0 | 0.1% | 0 | 0.0% | 0 | 0.0 | 0 |
| Royce Freeman | RB | 1 | 0.0 | 0.1% | 1 | 100.0% | 11 | 11.0 | 0 |
| Stone Smartt | TE | 1 | 0.0 | 0.1% | 0 | 0.0% | 0 | 0.0 | 0 |
Built from the 26 games Tyrod Taylor threw a pass in (team totals in games where more than one QB attempted a pass).